10-53
IM 701310-01E
Analysis and Search
3
2
1
4
5
6
7
8
9
10
11
12
13
14
15
16
17
18
19
App
Index
10.9 Displaying the Frequency Distribution of a
Specified Area (Accum Histogram)
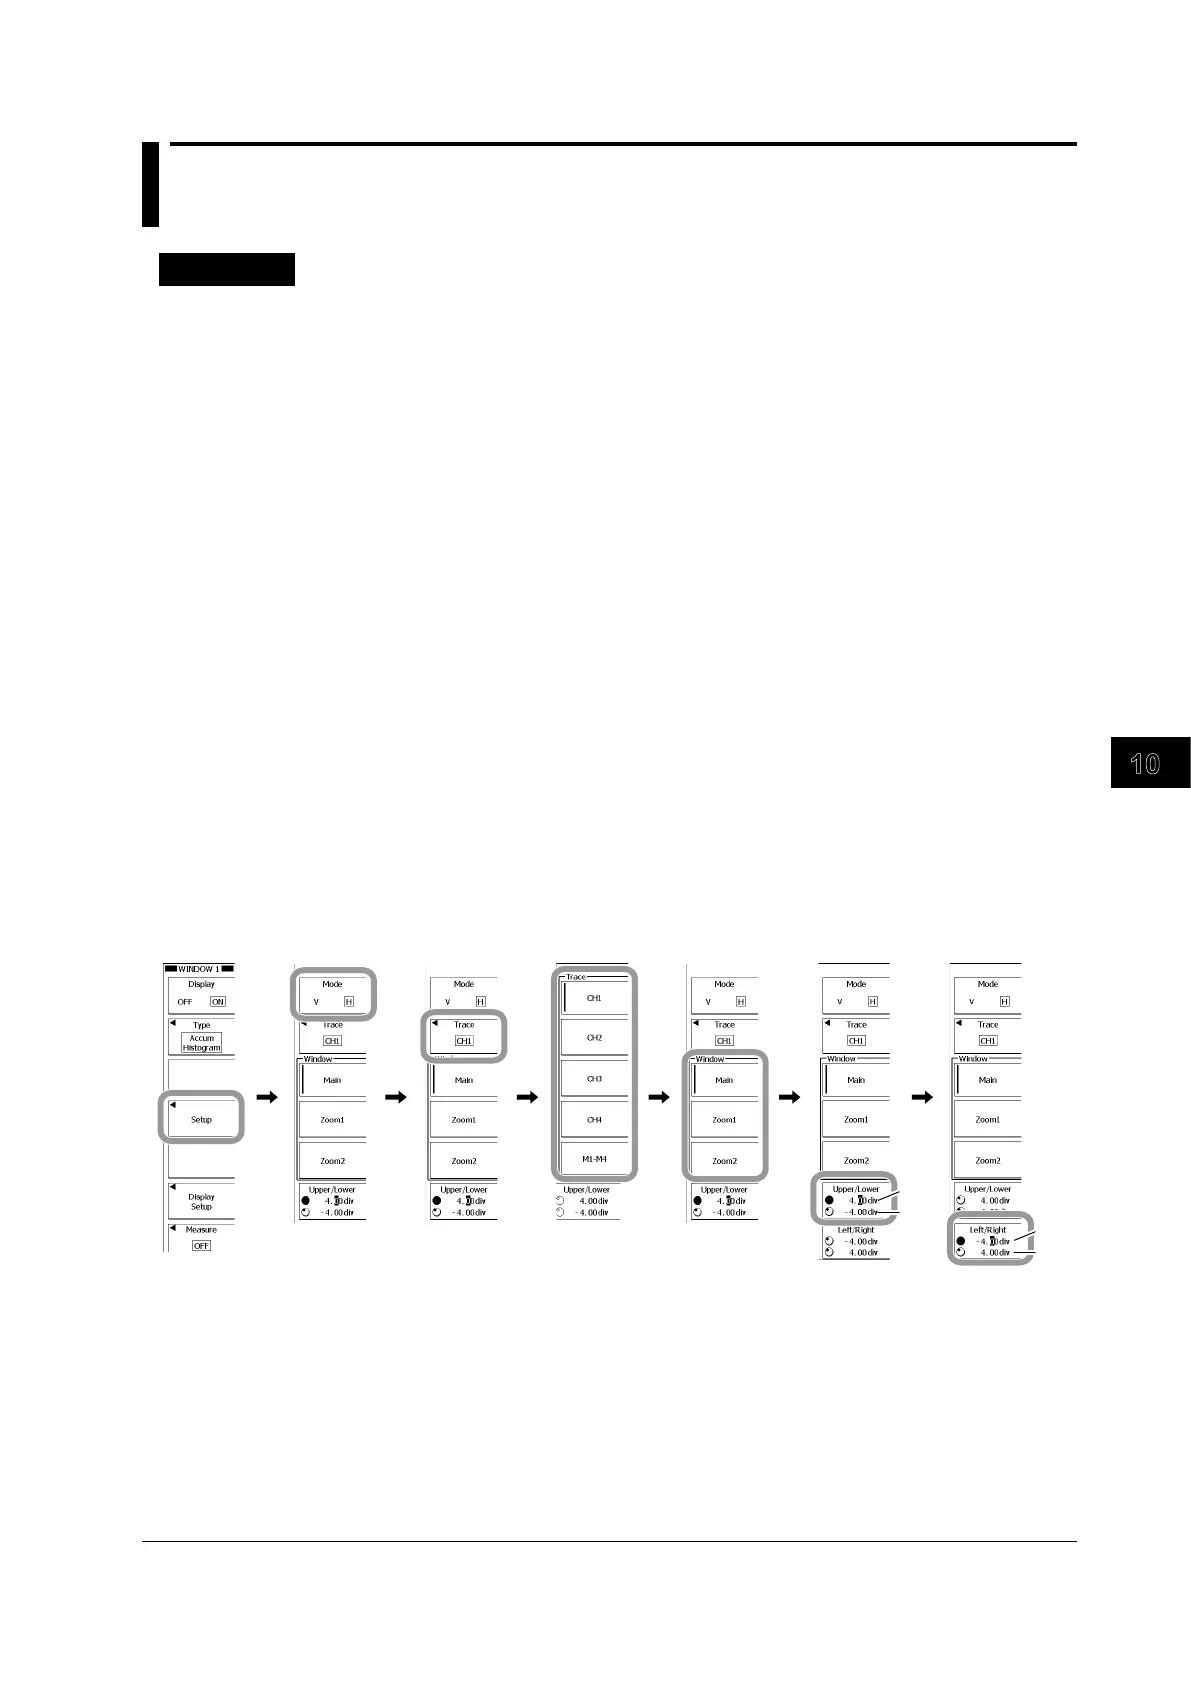
Procedure
1.
Carry out steps 1 to 4 in section 10.5 to set the analysis type to Accum Histogram.
2.
Press the Setup soft key.
Selecting the Axis
3.
Press the Mode soft key to select V or H.
If you select V, a vertical histogram appears. If you select H, a horizontal histogram appears.
Selecting the Display Source Waveform
4.
Press the Trace soft key.
5.
Press the soft key that corresponds to the waveform to display the frequency
distribution of.
To select a channel from M1 to M4, press the
M1-M4
soft key first.
Setting the Source Range
6.
Press the appropriate soft key from Main to Zoom2 to select the window that you
want to set the time range for.
7.
Press the Upper/Lower soft key.
8.
Use the rotary knob to set the source range upper and lower limits.
Press the soft key to select the limit that you want to set using the rotary knob.
9.
Press the Left/Right soft key.
10.
Use the rotary knob to set the source range left and right edges.
Press the soft key to select the edge that you want to set using the rotary knob.
11.
Press ESC to return to the previous screen.
 Loading...