Chapter 24 Traffic Status
VMG8924-B10D/B30D User’s Guide
250
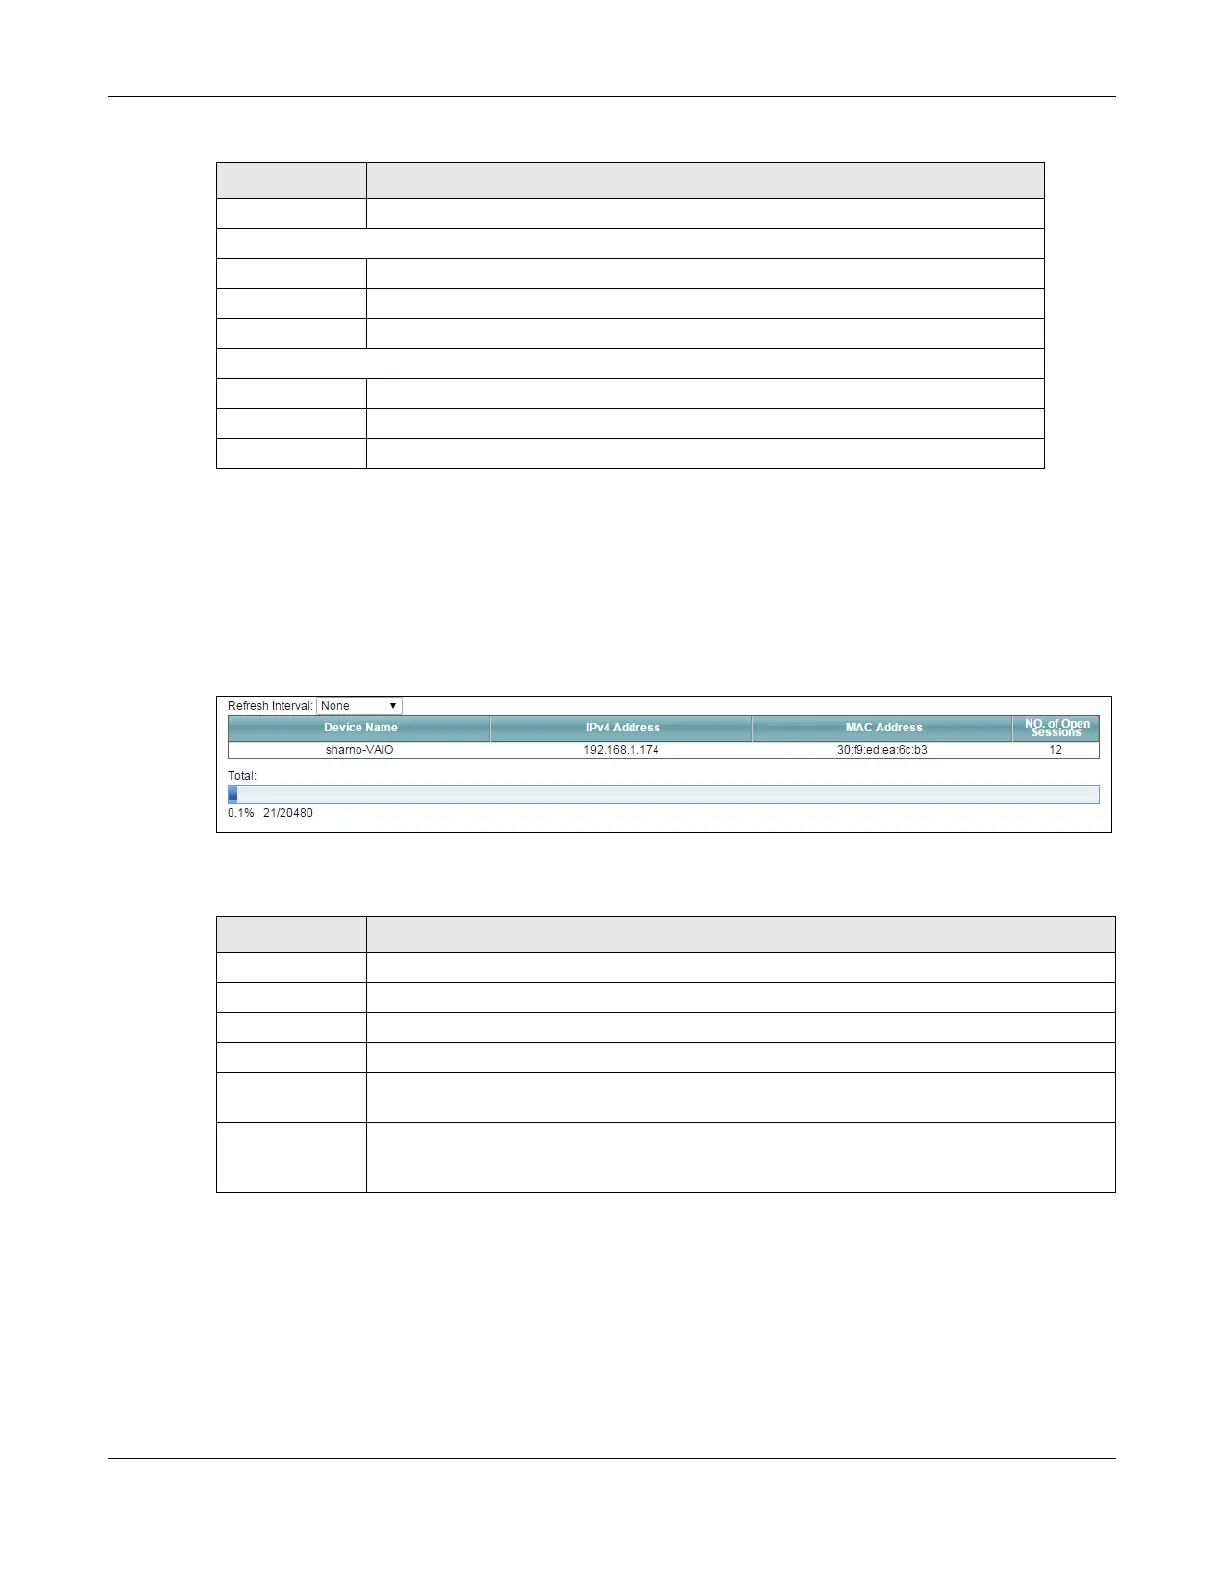
24.4 The NAT Status Screen
Click System Monitor > Traffic Status > NAT to open the following screen. The figure in this screen shows
the NAT session statistics for hosts currently connected on the VMG.
Figure 145 System Monitor > Traffic Status > NAT
The following table describes the fields in this screen.
Interface This shows the LAN or WLAN interfaces.
Sent (Packets)
Data This indicates the number of transmitted packets on this interface.
Error This indicates the number of frames with errors transmitted on this interface.
Drop This indicates the number of outgoing packets dropped on this interface.
Received (Packets)
Data This indicates the number of received packets on this interface.
Error This indicates the number of frames with errors received on this interface.
Drop This indicates the number of received packets dropped on this interface.
Table 119 System Monitor > Traffic Status > LAN (continued)
LABEL DESCRIPTION
Table 120 System Monitor > Traffic Status > NAT
LABEL DESCRIPTION
Refresh Interval Select how often you want the VMG to update this screen.
Device Name This displays the name of the connected host.
IPv4 Address This displays the IP address of the connected host.
MAC Address This displays the MAC address of the connected host.
No. of Open
Session
This displays the number of NAT sessions currently opened for the connected host.
Total This displays what percentage of NAT sessions the VMG can support is currently being used by
all connected hosts. You can also see the number of active NAT sessions and the maximum
number of NAT sessions the VMG can support.
 Loading...