Chap. IV - Record Analyzer
Scope_manual_en-v110.docx — 79 —
The course is stored directly in the PC by means of saving individual “screens” (Print Screen, Screen
Shot). Then these screens are put together into an animation string. They are NOT LINKED to each
other in time (see Pos. 2, Fig. 183) and therefore separating vertical black lines (see Pos.1, Fig.
183). are inserted between the individual “screens” (see Pos. a, b, c, d, Fig. 183).
Note:
In the course of a quick sampling it is not possible to continuously load and transfer data at the same
time therefore the data are scanned one screen after another. And that is why the loss of data occurs
when the data are transferred from the oscilloscope memory to the PC. These “lost” data are
displayed as the above-mentioned vertical black line on the screen.
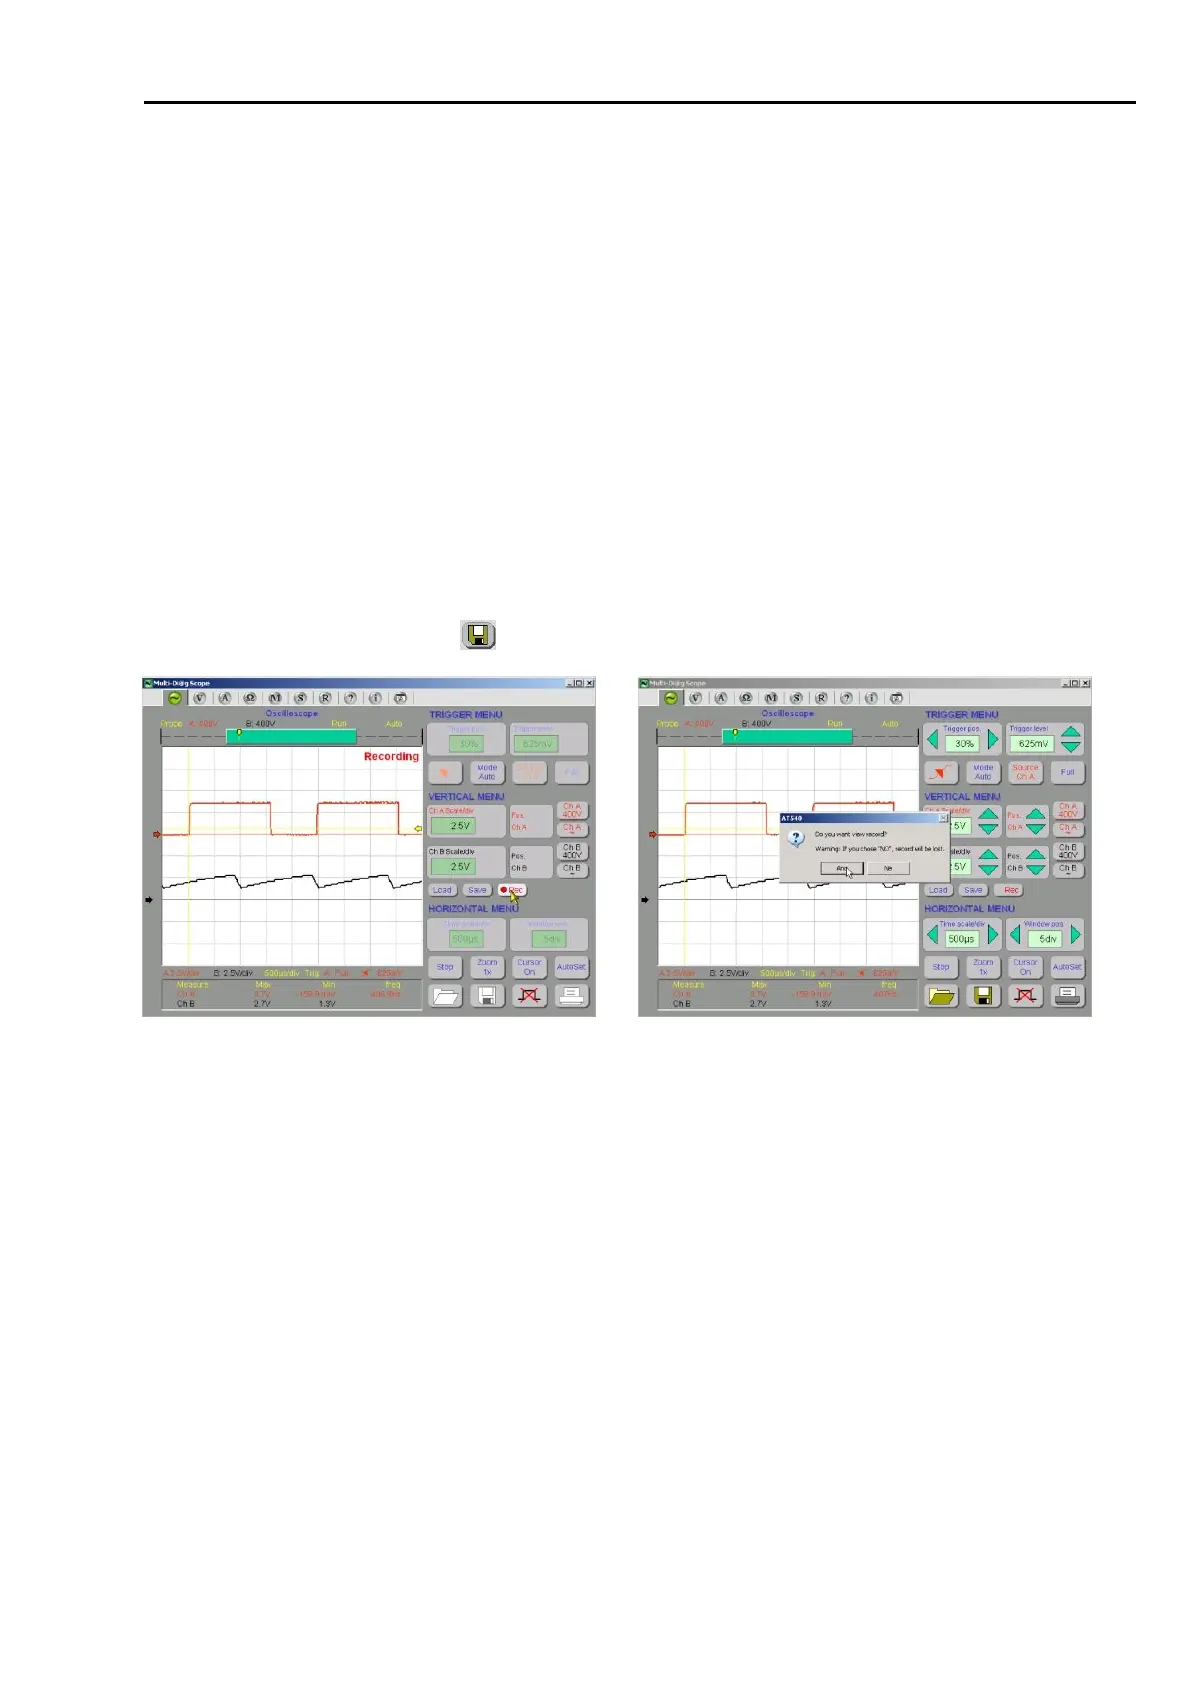
You can interrupt the scanning by the repeated clicking on the “Rec“ button (see the cursor in Fig. 173)
or by the mouse clicking anywhere in the oscilloscope raster.
To display or to store the record, you MUST positively confirm the message according to Fig. 182.
After the positive confirmation, the Record Analyzer will be triggered (Fig. 183).
After the negative confirmation, the record will be lost beyond recovery.
Recommendation:
To be able to analyze the record later, do save the record to your PC (HDD, USB Flash Disk etc.) by clicking on
the icon symbolizing the floppy disk (Pos.10, Fig. 184).