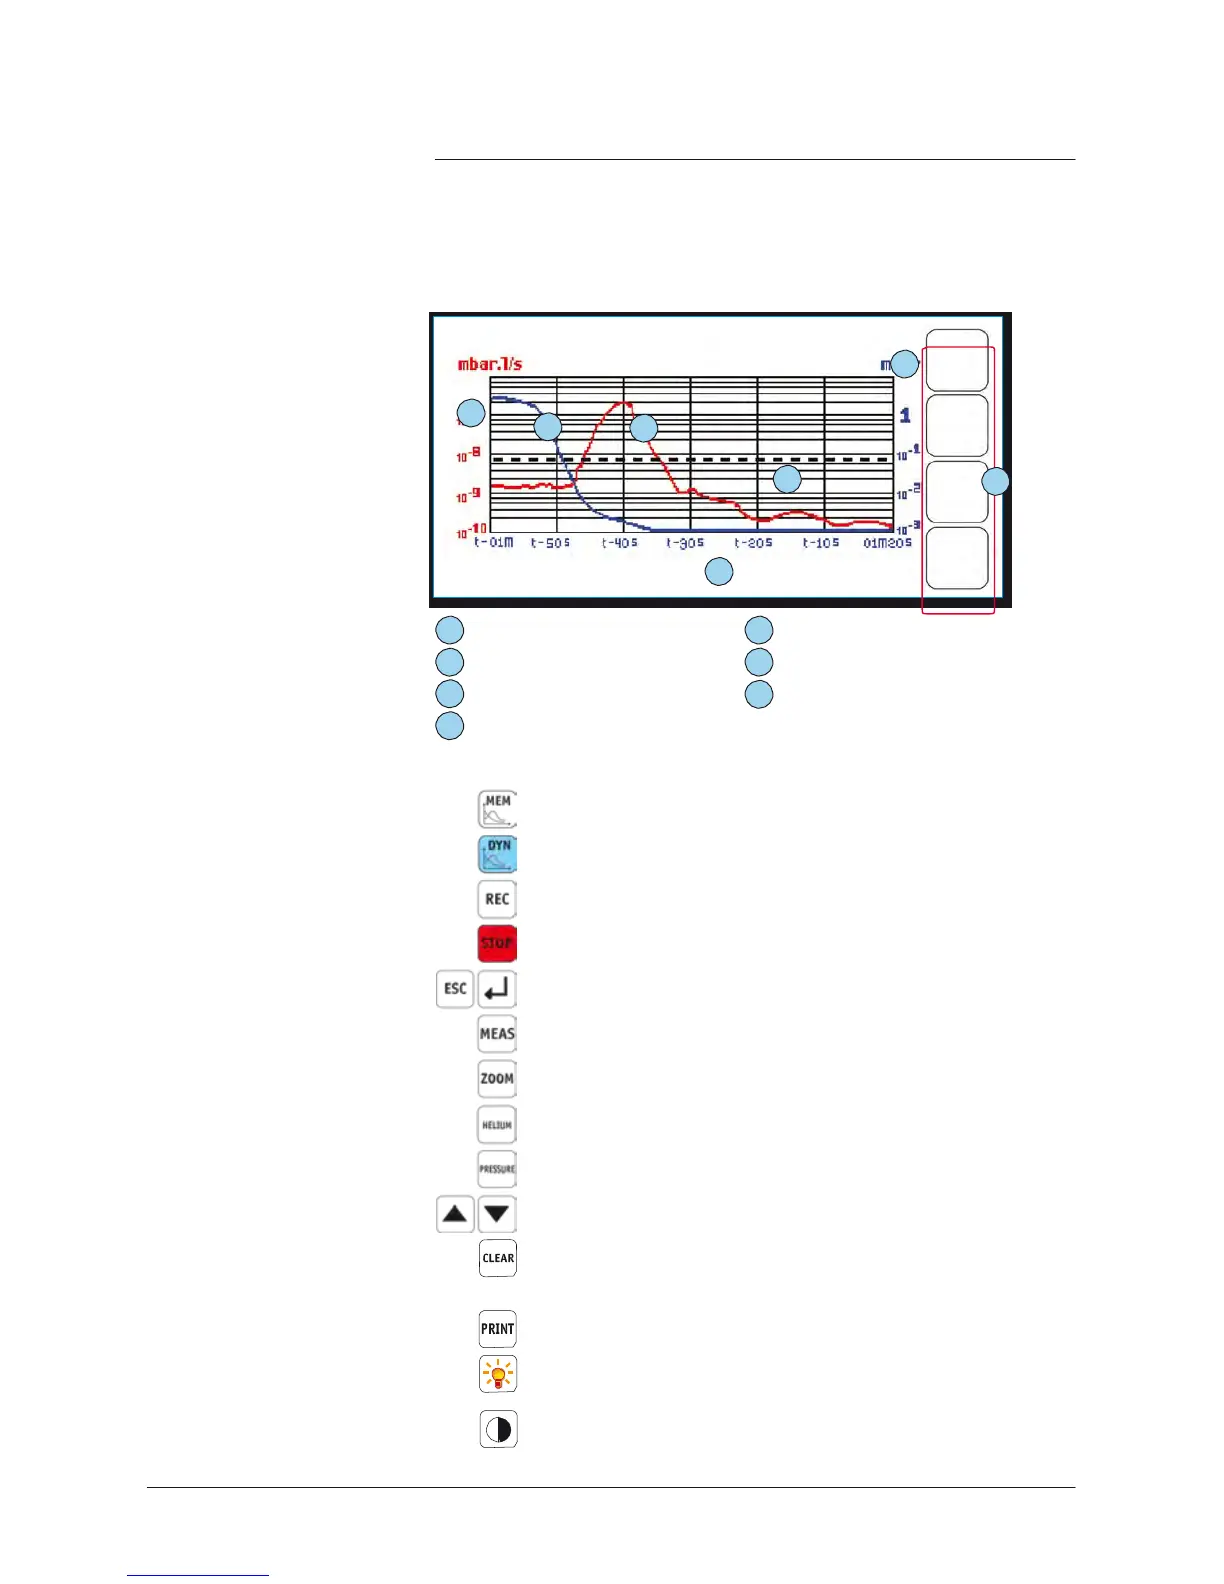
Graphic
inter
face
description
3
1
4
2
5
7
6
1
Helium signal scale
2 Helium signal (red curve)
3
Inlet
pressure
scale
4
Inlet
pressure
(blue curve)
5
Reject
threshold (black curve)
6
Time
scale
7
Selection
keys: see details
below
Selection
keys
Access
to the memorized graph display
Access
to the dynamic graph display
Start recording a graph
Stop recording a graph
Return
to the previous
screen
or the standard interface
Exact
value display for a
selected
point
Zoom on the
selected
area
Helium signal curve selection
Inlet
pressure
curve selection
T
arget
moving
Deletion of the curve displayed on the screen
A
message
is displayed in order to confirm the operation.
Memorized graph recording
Access
to the leak
detector vacuum
diagram
Contrast
adjustment