1x10
-9
mbar
.l/s
Spray
method
(inboard testing)
This involves removing air from the test part,
connecting
it to
the
analyzer
and then
spraying
helium over the outer sur
face.
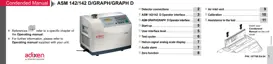
Global
test
Spray
test
or
par
t
spray
probe
He
part
He
detector
detector
The part is
placed
under
a
cover, into which helium is
injected.
The leak cannot be
located.
Potential leaking
areas are
sprayed
with
helium.
The leak can be
located.
The detector measures the flow of helium
penetrating
the
par
t.
Response time
When
spraying
starts, the leak signal is not
displayed instantaneously
on the
analyzer:
there is
a response
time which
depends
on the volume V being
tested
and the helium pumping speed S of the system at the
opening
of
the
part,
according
to the following
relation:
T
= V/S
(T
in
seconds,
V in litres, S in
l/s)
T
is the time required for the signal to reach 63 % of the final
value.
2
/4