User Manual 5 Step-by-Step Guides
64
The acquired spectrum appears in the
spectrum chart and the quantification results
in the spectrum list (refer to
(element identification, quantification).
Use the workspace icon to
Alternatively, drag and drop the spectrum
from the spectrum list
he project has to be saved manually (see
Use the spectrum chart icon to
a) Save spectrum (or result list, element
selection, graphic)
Highlight spectra in the spectrum list to save
several spectra. Alternativel
the spectrum. Various file formats are
possible
*. To include all meta data use the
.spx format. Refer to section 5.8 and 5.12.1.
Alternatively, drag and drop the spectrum
from the spectrum list
he project has to be saved manually (see
*optional, license-based
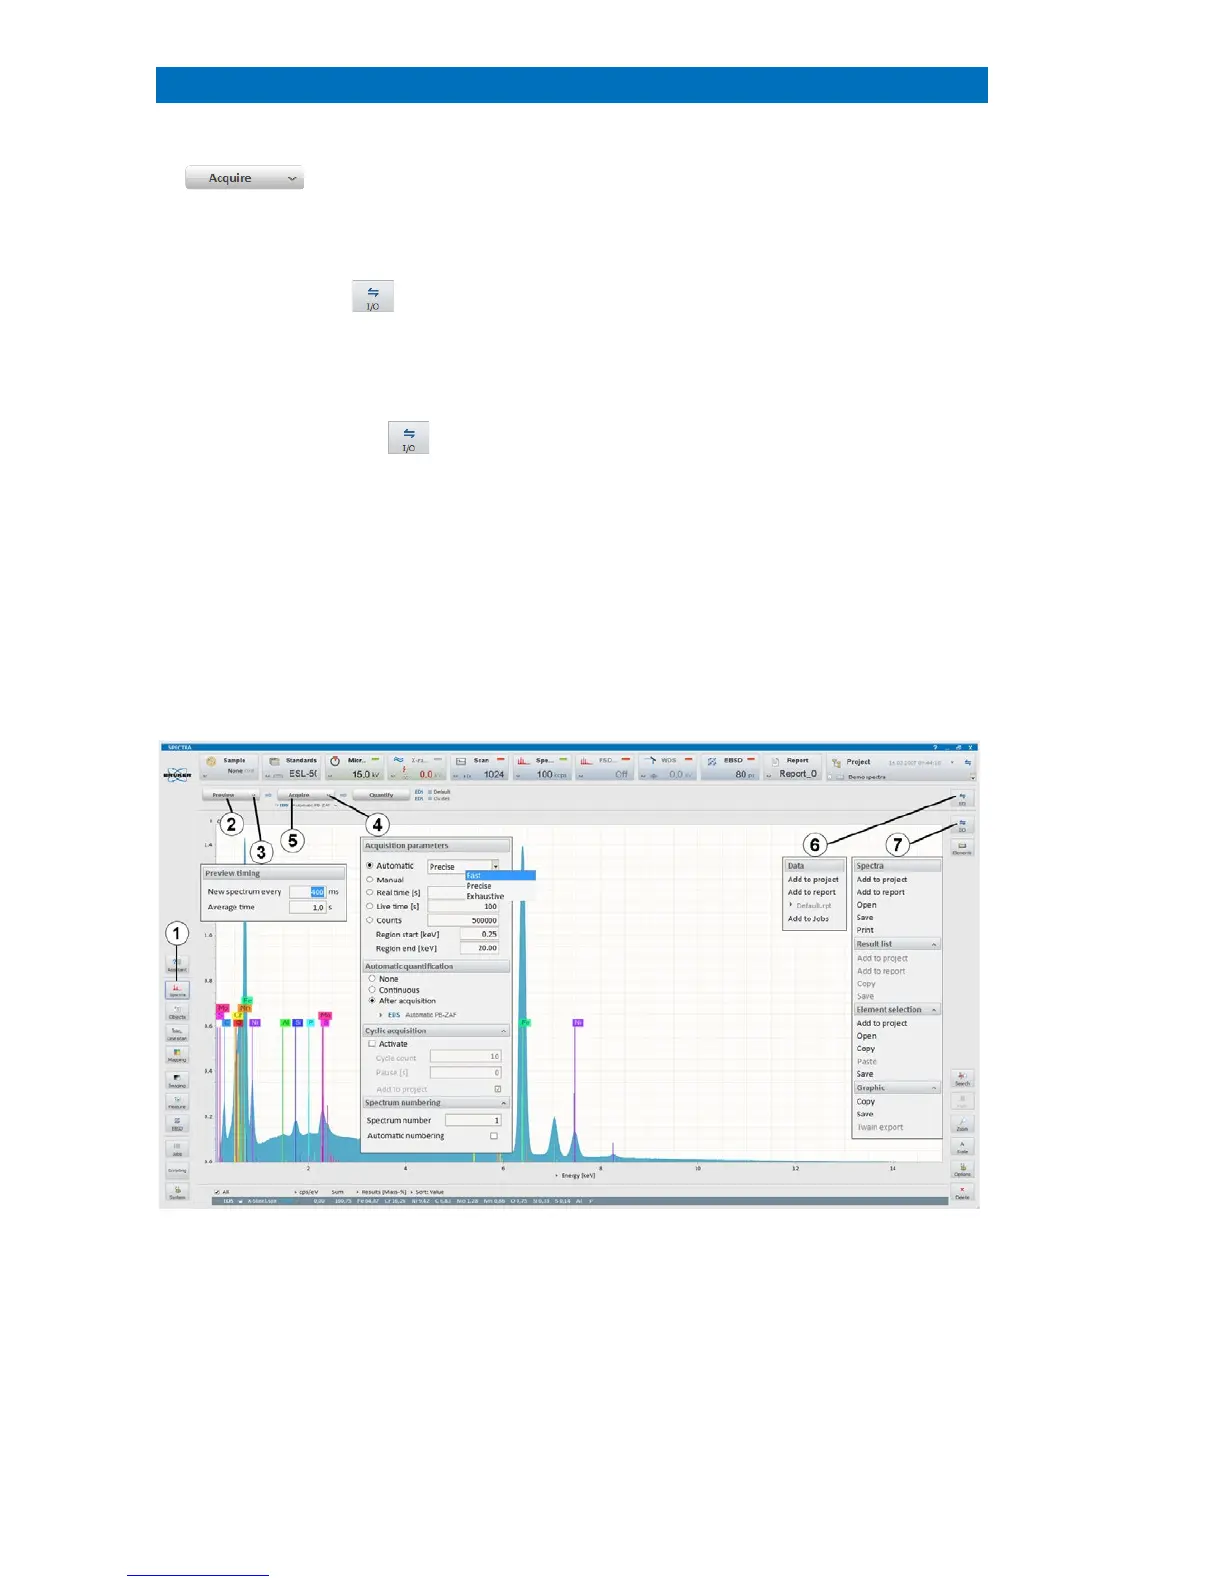
Fig. 5.7-1 Spectrum acquisition
 Loading...