User Manual 5 Step-by-Step Guides
66
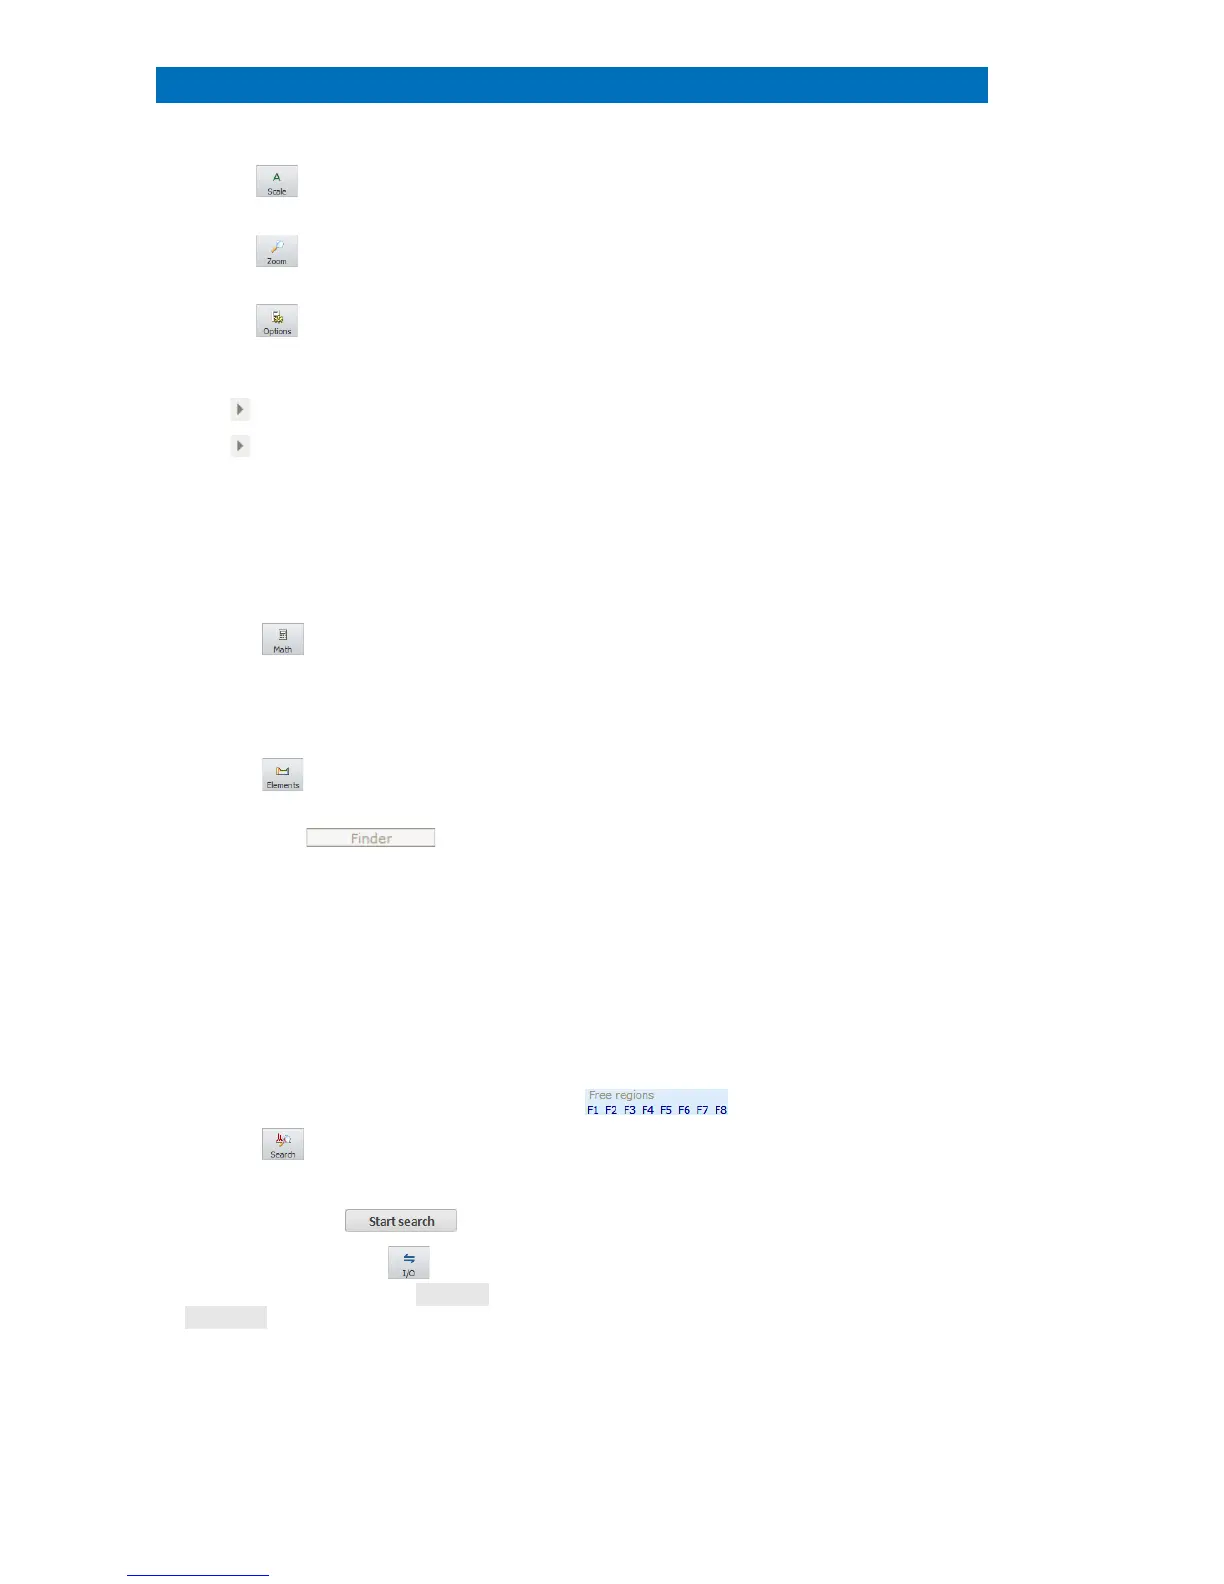
the icon for Automatic scaling
(spectrum fills display area)
Set a rectangle by holding the left mouse key
to zoom into the area of interest.
the icon or right click on the
chart and select Properties…
to
change Spectrum display properties.
To normalize multiple spectra for comparison,
select
Individual scaling and Automatic
and
select an energy region with right mouse
button.
Click next to the x-axis dimension.
Toggle between energy (keV) and channel.
next to the y-axis dimension.
Toggle between cps/eV or channel and
pulse/eV or channel.
Right click on the x or y scale bar.
Adjusting the x and y scaling.
Double click on a spectrum in the
spectrum list to access Spectrum
properties
Detector, Parameter, and Spectrum).
Quantification results, sample info, detector
(detector parameters),
arameter (Acquisition
parameters),
spectrum (Energy calibration
data) can be here retrieved.
the icon to select the desired
The SPECTRA ARITHMETIC dialog opens.
Available from the dropdown list are
, maximum and minimum. The
spectrum will be added to the
icon to select or de-select
Any element can be selected or de-selected
just by clicking the according symbol.
Select the tab in the
periodic table
The Finder option supports the identification
of unknown peaks in the spectrum. Place the
spectrum cursor over the center of a peak
ght the peak range by dragging the
cursor with pressed right mouse button to
display a list of all possible elements. The first
element of this list is that one with the
highest probability of
Highlight a region in the spectrum (by
dragging the spectrum cursor with the
right mouse button pressed) and select a
free region (F1-F8).
Up to 8 spectral regions can be assigned to
monitor non
-analytical peaks or background
icon on the right side of
the spectrum chart and choose the
location where the reference spectra are
located. Then click .
SEARCHING FOR SIMILAR SPECTRA dialog
opens. Foun
d spectra will be added to the
spectrum list in the dialog.
Use the sensitivity
slider (cross correlatio
select Add to project in the
Add the element selection to the project.
 Loading...