© EPRAD Incorporated
Voltage Logging
The eCNA-10 can log line voltage data collected from the LVM-250 Line Voltage Monitor. The VoltHiLo
Event (#105) contains the highest and lowest line voltage values collected since the last logged
VoltHiLo event. The Voltage Logging Period parameter on the LVM-250 Voltage Monitor setup screen
sets the logging interval. The range is 0:00 to 59:59 in minutes and seconds. 0:00 suppresses
logging of the event.
Logging the line voltage can be helpful in detecting problems, such as voltage sags, surges, brown-
outs or total failure of utility power that can cause problems with or even damage the cinema
equipment.
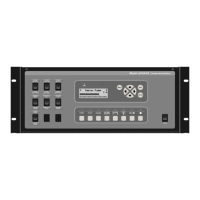
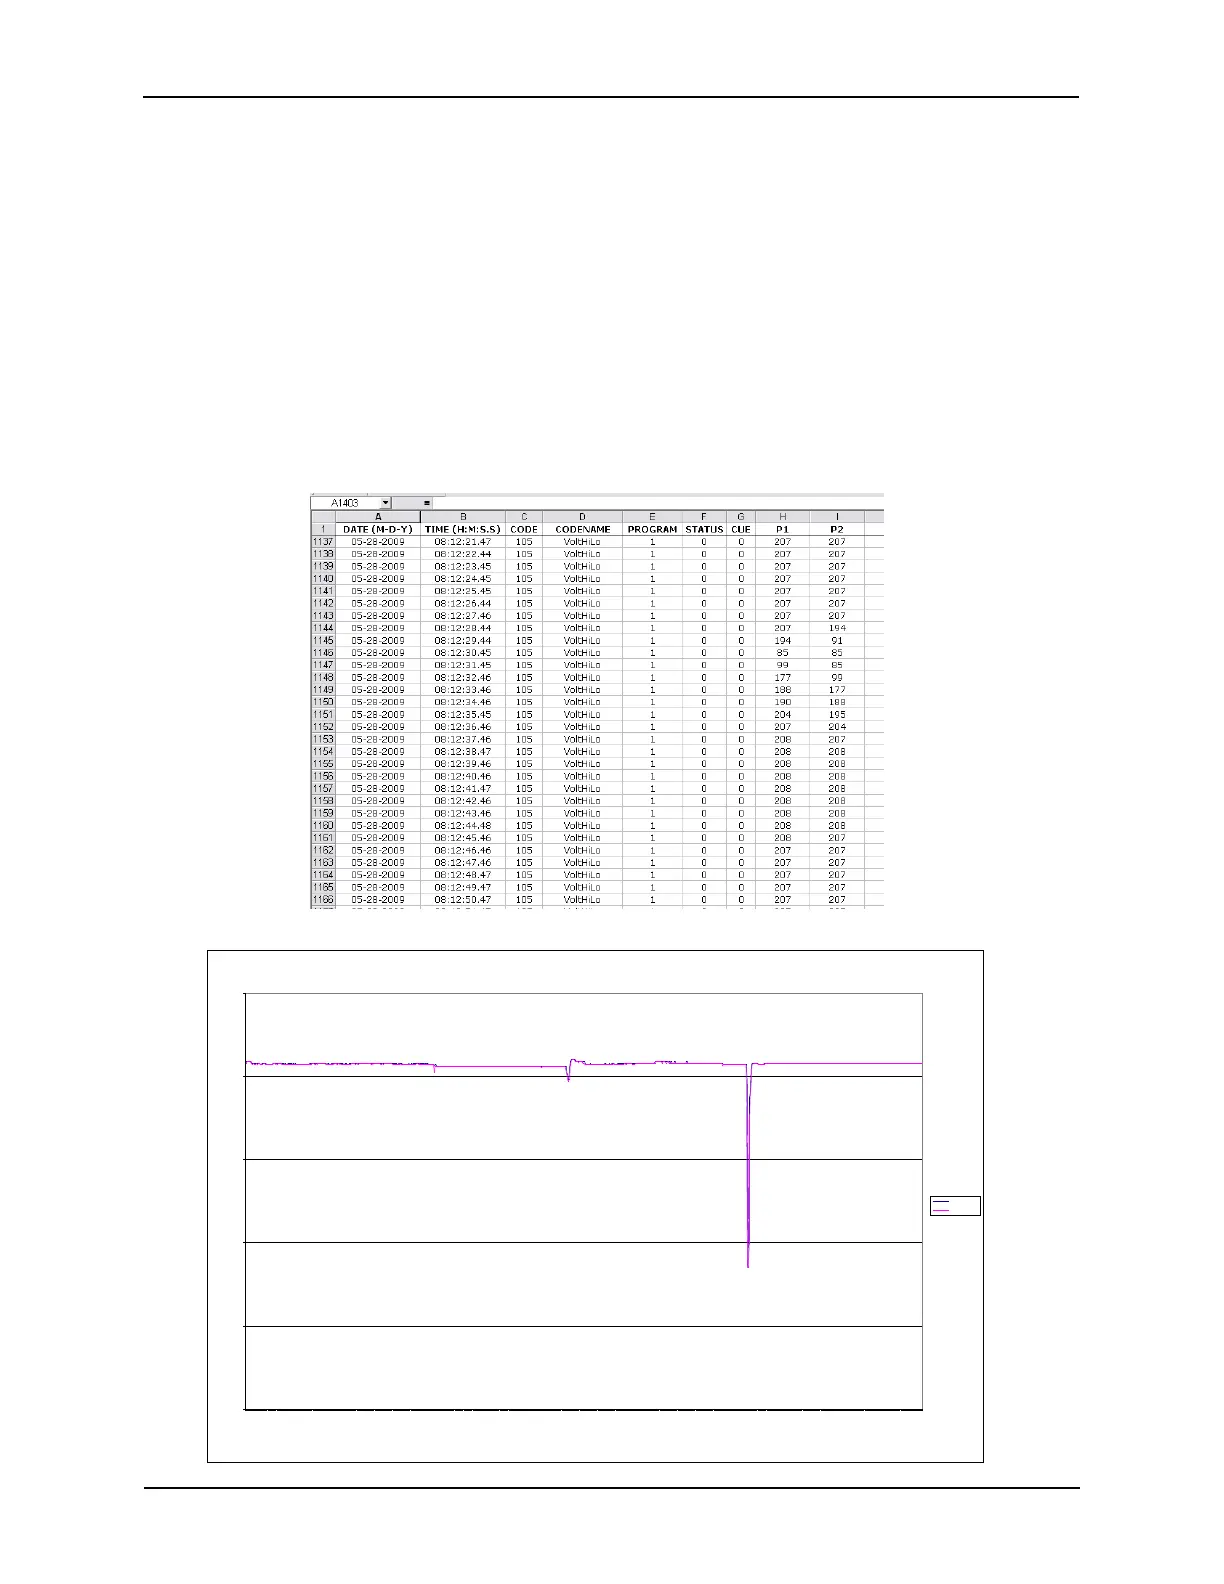
Just for fun, the following graph was created with both high and low line voltage plotted over a 15
minute period. The voltage was collected every second. The graph was created in an Excel
Worksheet with imported VoltHiLo Event records.
Line Voltage P lot
0
50
100
150
200
250
08:00:11
08:00:28
08:00:45
08:01:02
08:01:19
08:01:36
08:01:53
08:02:10
08:02:27
08:02:44
08:03:01
08:03:18
08:03:35
08:03:52
08:04:09
08:04:26
08:04:43
08:05:01
08:05:18
08:05:35
08:05:52
08:06:09
08:06:26
08:06:43
08:07:00
08:07:17
08:07:34
08:07:51
08:08:08
08:08:25
08:08:42
08:08:59
08:09:16
08:09:33
08:09:50
08:10:07
08:10:24
08:10:41
08:10:58
08:11:15
08:11:32
08:11:49
08:12:06
08:12:23
08:12:40
08:12:57
08:13:14
08:13:31
08:13:48
08:14:05
08:14:22
08:14:39
08:14:56
08:15:13
08:15:30
08:15:47
08:16:04
08:16:21
08:16:38
T im e
Volts
S e r ies1
165
eCNA-10 Operation and Installation Manual Version 1.270-00