Operating NetDAQ Logger for Windows
Real-Time Displays
4
4-11
Quick Plot 4-12.
Quick Plot provides a quick way to get a simple graphical view of your logging
data. Quick Plot samples the incoming scan data at a specified interval and
displays a graphical trend of the data. For a more detailed view of your data, use
the Trend Link application. Complete the following procedure to set up and
display the Quick Plot window. To return to the Quick Plot Setup dialog box at
any time, double-click in the Quick Plot window. During simulated logging,
Quick Plot shows simulated data.
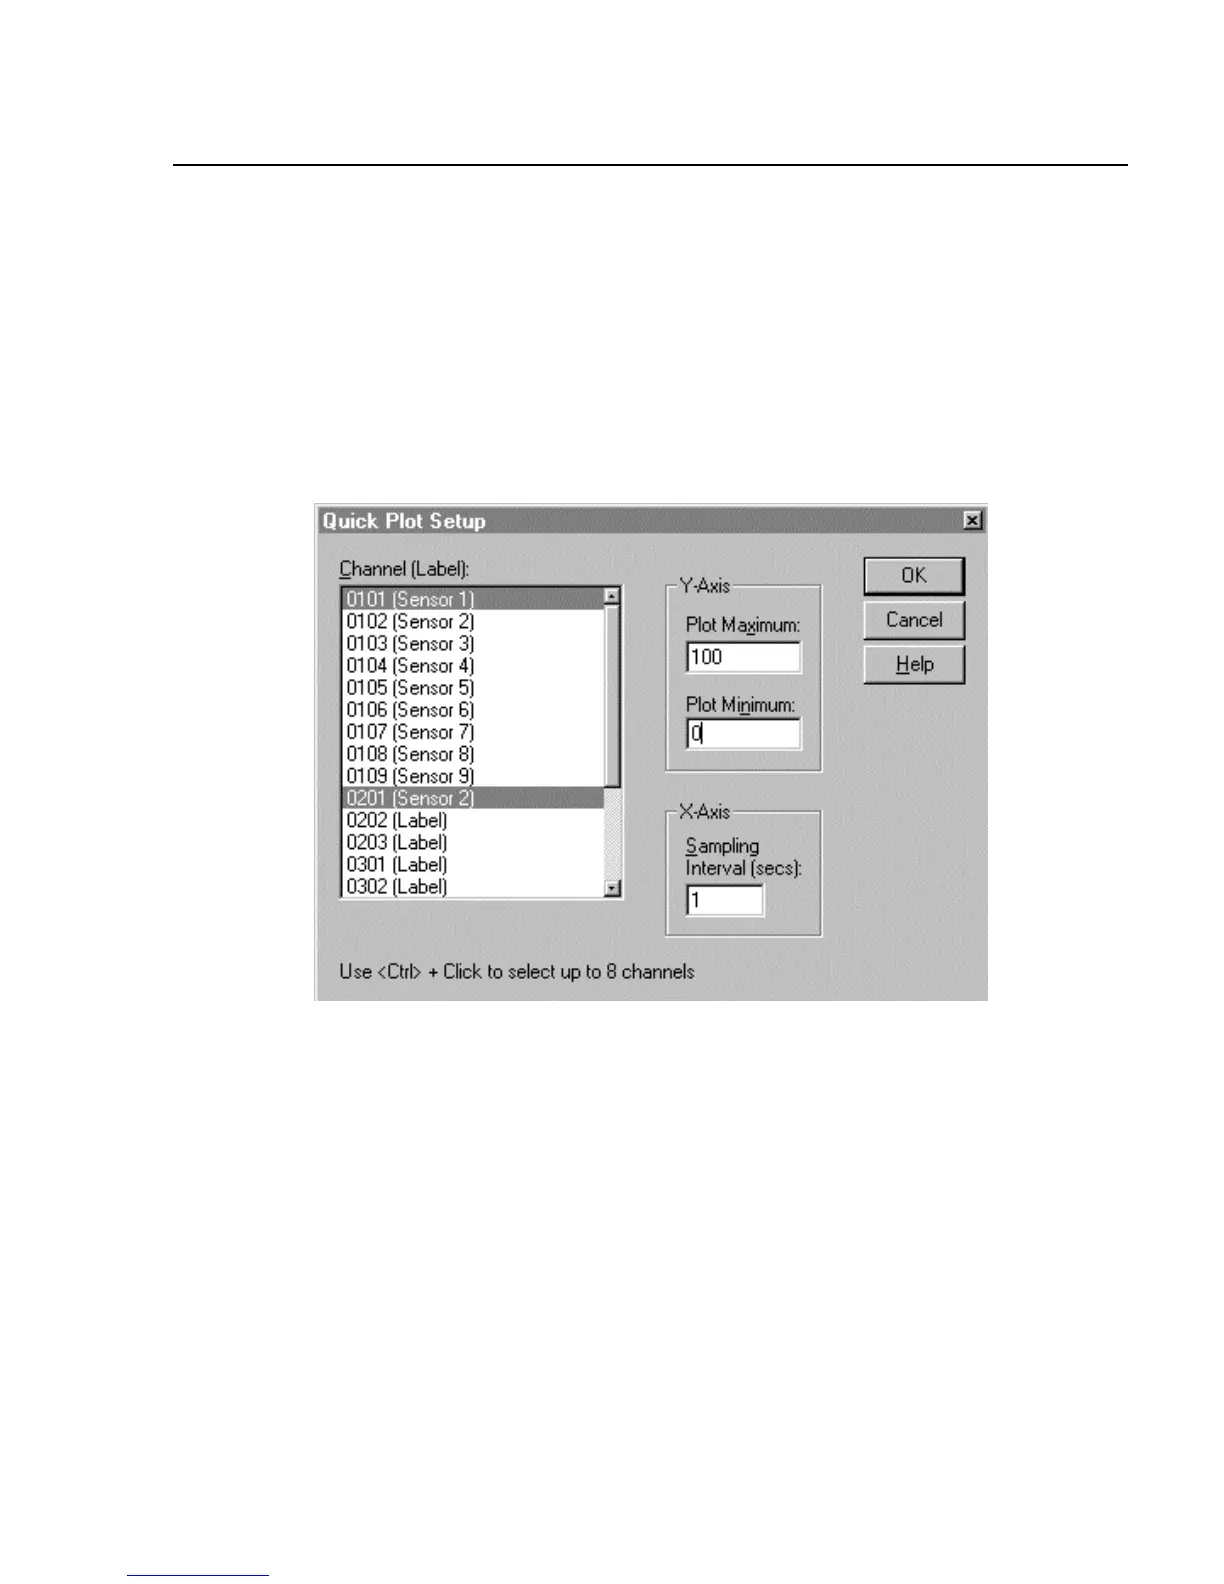
1. Select Plot/Trend | Quick Plot Setup to open the Quick Plot Setup dialog box
is shown.
ds043s.bmp
2. Select up to eight channels from the Channel list. Enter the Y-Axis scale and
the X-Axis sampling interval. The example above is typical of setting up a
Quick Plot. Click OK.
A summary of Quick Plot attributes is shown below.