2640A/2645A NetDAQ
Users Manual
G-6
7. Continue with other Excel functions to show charts and features. (See your
Excel documentation.)
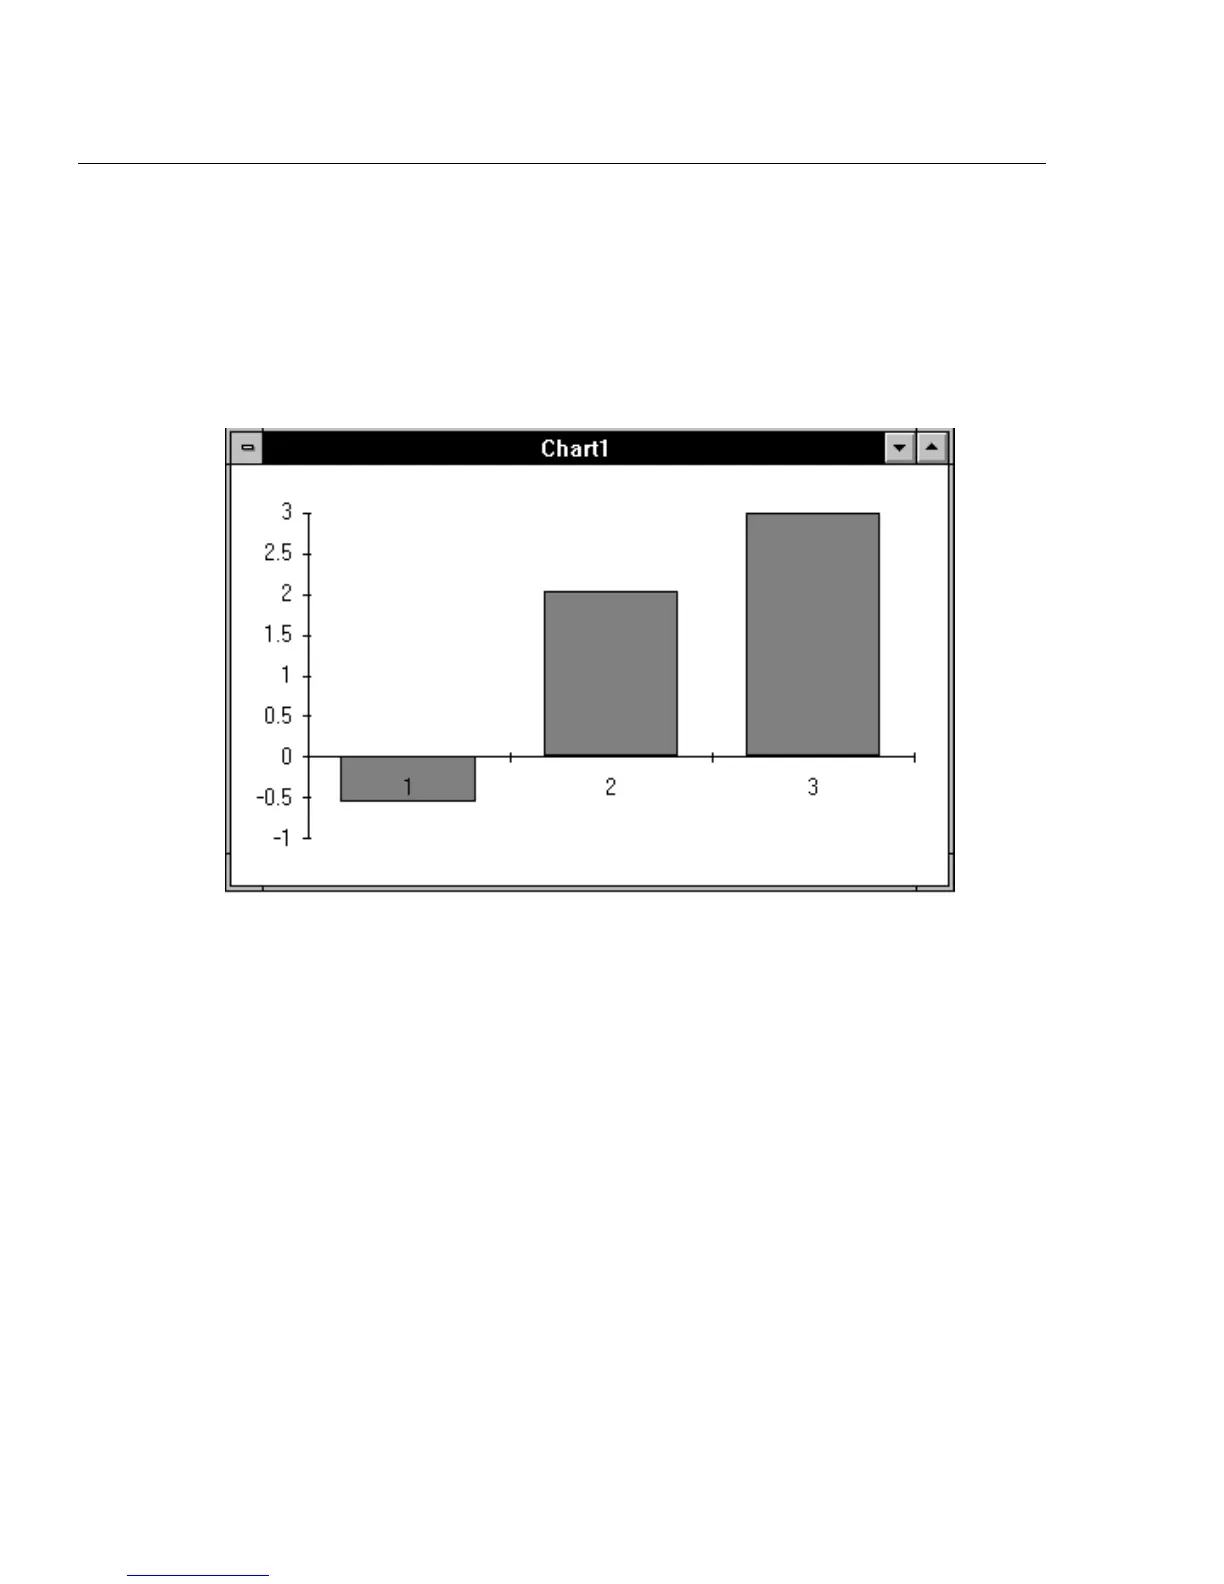
For example, select cells A1, A2, and A3 (click on each cell while holding
down the <Cntl> key), then select the New command from the File menu.
Click on Chart and then OK. A chart is displayed for the three channels,
which updates with each new measurement at a maximum rate of once per
second (see the example below).