QUANTUM™ LX EVAPORATOR CONTROL PANEL
OPERATION
090.610-O (MAR 2016)
Page 37
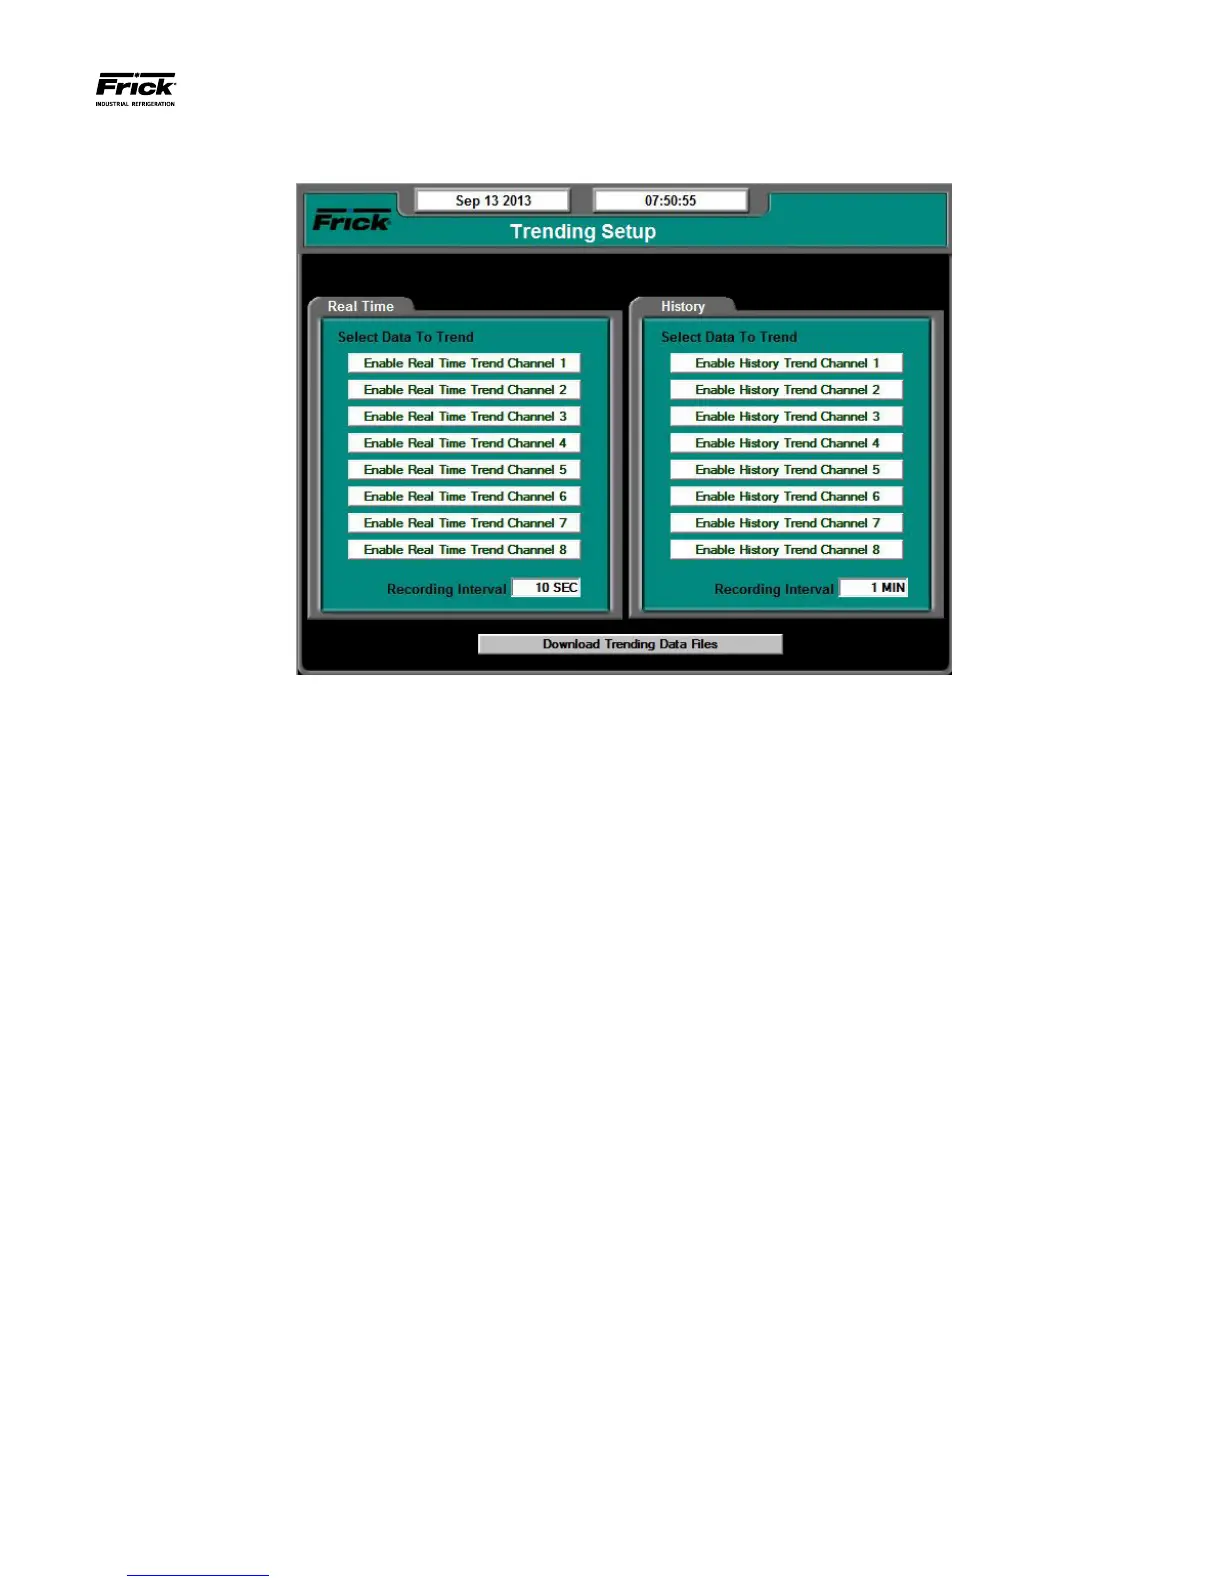
SYSTEM STATUS - Trending - Trending Setup
DESCRIPTION: This is the Trending Setup screen. Up to eight
channels can be monitored in real time trending, and up to
eight channels monitored in history trending.
Real Time Trending - is a method by which the user can set
the Quantum™ LX to map analog inputs to a graphic chart for-
mat. These analog input values are stored at a specic interval
over a corresponding period of time. The graphed values will
scroll across the screen from left to right, at a speed that is de-
termined by the recording interval. Two individual data points
can be viewed on the Real Time Data Log screen. A total of
900 values are stored. Trending data is lost upon power cycle.
The following setpoints are provided:
Real Time Recording Interval – The time interval that
denes how often the real time trending data values are
updated. This value may be set for any time duration be-
tween 1.0 second and 86,400.0 seconds (24 hours).
History Trending - is a method by which the user can set
the Quantum™ LX to record analog inputs to a graphic
chart format. This feature is similar to Real Time trending,
except that the data is not lost at power cycle. The events
that occur will scroll across the screen, at a speed that
is determined by the recording interval. A total of 2000
values are stored.
History Recording Interval – The time interval that de-
nes how often the history trending data values are up-
dated. This value may be set for any time duration be-
tween 1.0 minute and 60.0 minutes (1 hour).
To program this screen with the data you wish to trend, high-
light the Enable Real Time Trend Channel 1 (or whatever chan-
nel you wish to use), by using the tab key. Once the box has
been selected, a drop down menu will appear for that channel.
On the right hand side of the drop down box will be an arrow.
Selecting the arrow will to cause all the possible settings for
the channel to appear. Use the tab key to scroll through the
list. When the selection that you want to use appears, press
the [Enter] key to select it. Once selected, the value for this
channel will be automatically trended and shown on the Real
Time Trending graph (or History Trending Graph), as well as
on the Real Time Trending Data Log (Or History Trending Data
Log).
The following screen command keys are provided:
• ZONE #1-30 - Return Air Temperature
• ZONE #1-30 – Ammonia
• ZONE #1-30 – Humidity
When in Remote Mode (not at the panel), the following key is
provided:
Download Data Trending Files - Pressing this key initi-
ates a download of the Real Time and History data les.
These les can then be imported into a database such as
Excel™. To use this feature, simply plug a USB compat-
ible device into the USB port of the Quantum™ LX. This
device can be a USB cable that is connected directly to a
personal computer, or a USB Flash Drive. When monitor-
ing remotely using a personal computer, and this button is
selected, a window will appear on the computer screen,
showing two les:
• Realtimexx.csv
• Historyxx.csv
The xx in both of these les will be replaced with the ID num-
ber of the Quantum™ LX. When the les appear in the screen
window, simply right click on either le, and select from the
menu “Save Target As…”, and save the les to a convenient
location. By using Windows Explorer™, you can then double
click on the le, and it will automatically open the le in Mi-
crosoft Excel™.