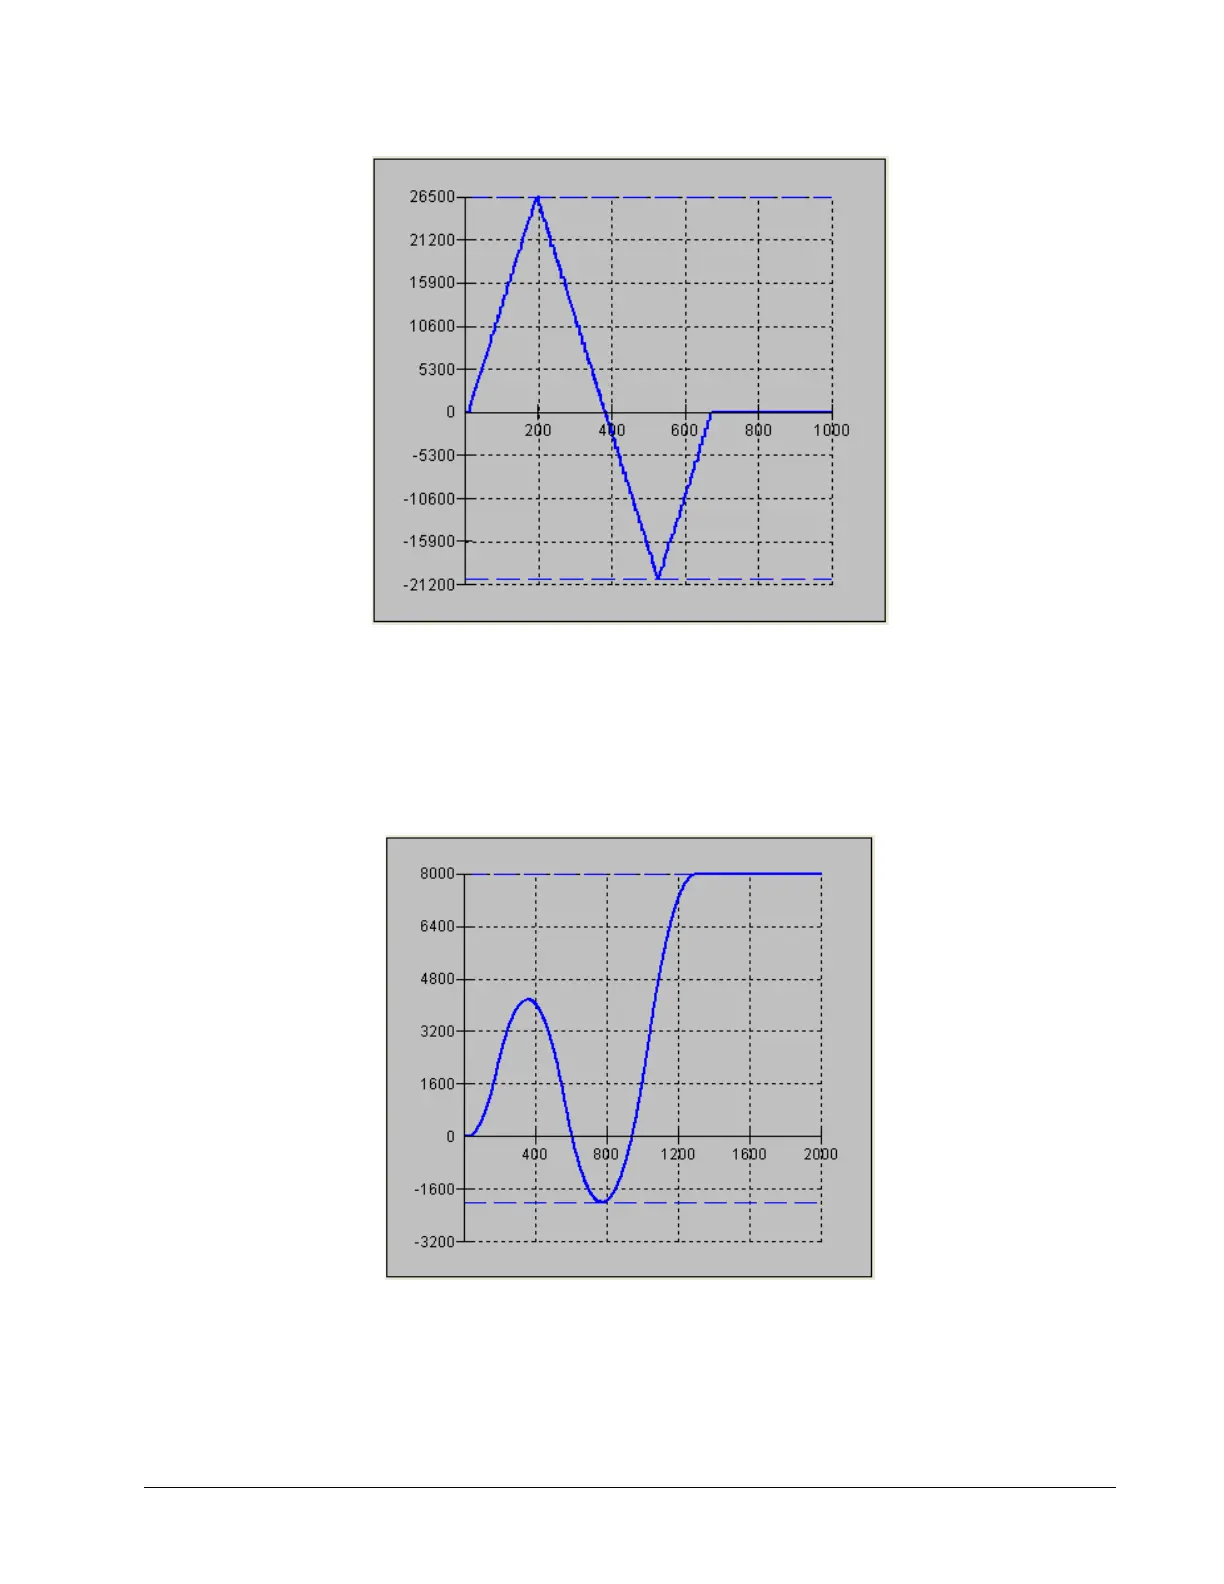
Figure 6.4: Velocity vs. Time (msec) Motion 2
Example Motion 4
In this motion, the host program commands the controller to begin motion towards position 5000, changes the target
to -2000, and then changes it again to 8000. Figure 6.5 shows the plot of position vs. time, Figure 6.6 plots velocity
vs. time, and Figure 6.7 demonstrates the use of motion smoothing (IT) on the velocity profile in this mode. The
jerk in the system is also affected by the values set for AC and DC.
Figure 6.5: Position vs. Time (msec) Motion 4
DMC-40x0 User Manual Chapter 6 Programming Motion • 84