462 IBM z13s Technical Guide
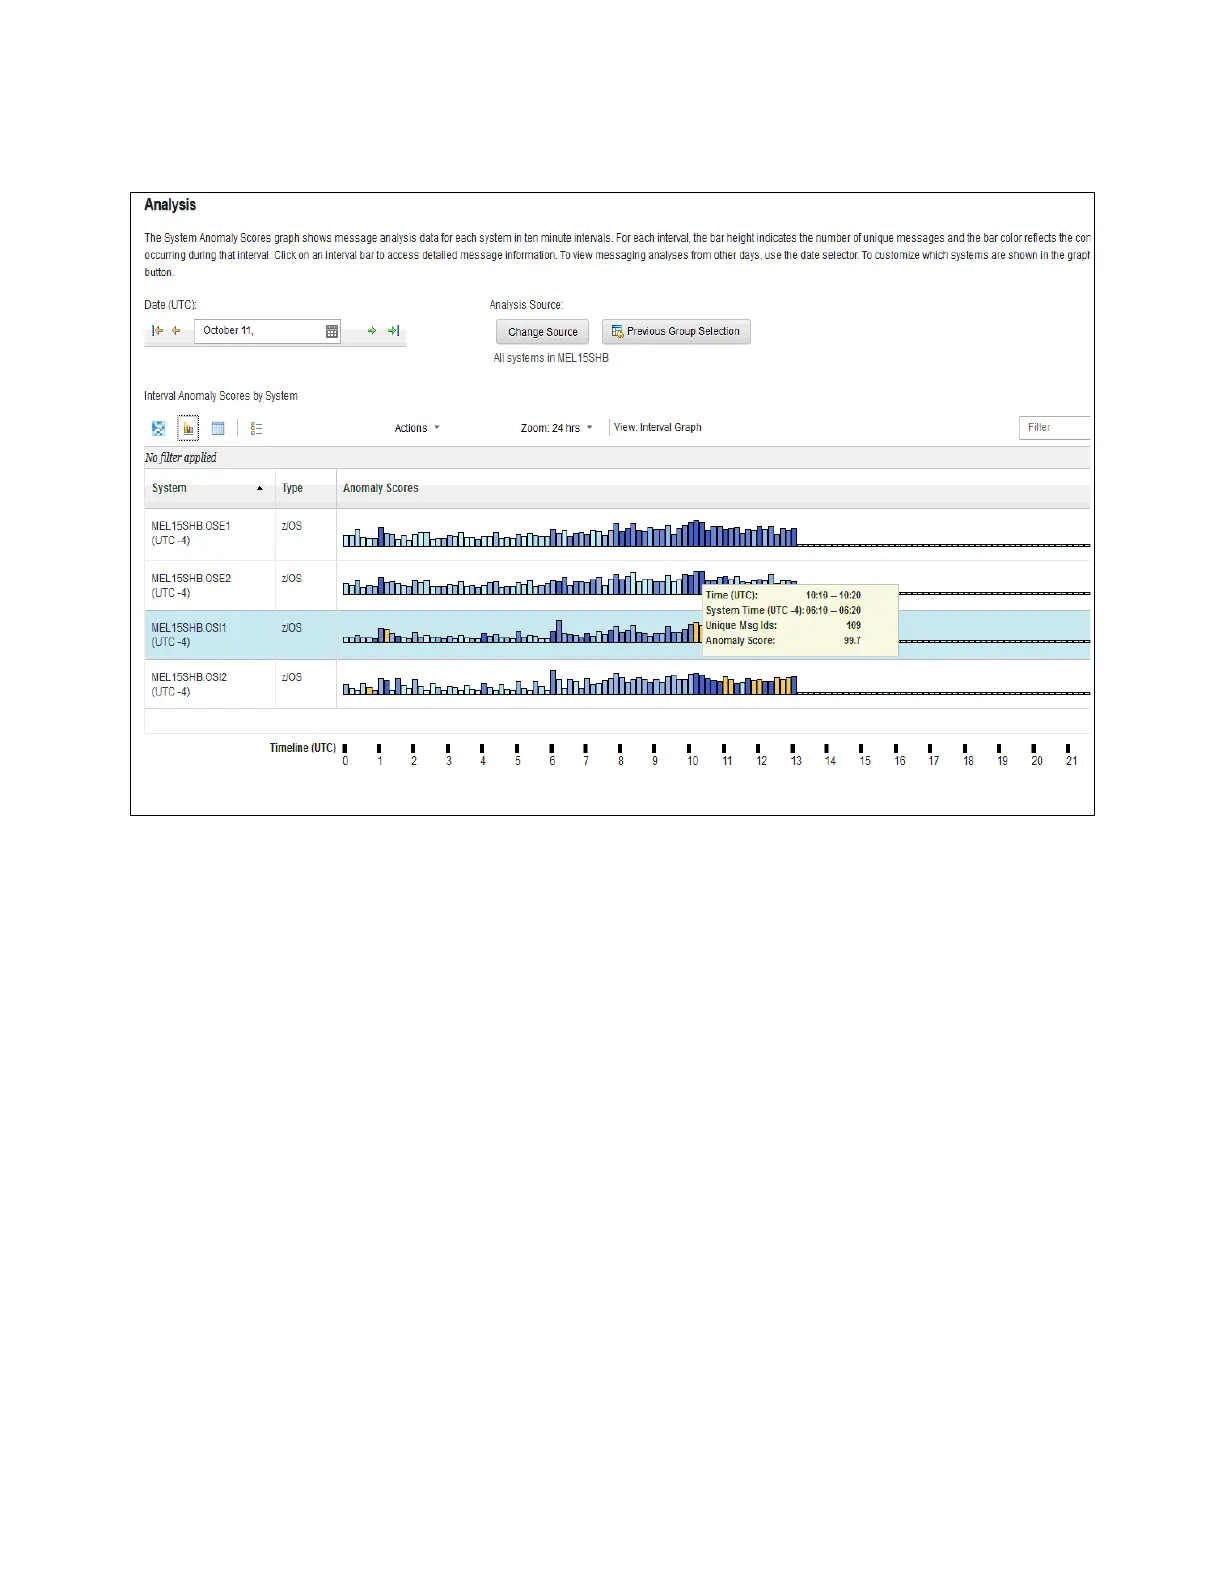
Figure B-7 shows a sample bar score view.
Figure B-7 IBM zAware bar score with intervals
The analytics create a statistical model of the normal message traffic that is generated by
each monitored client (system or group of systems, such as z/OS or Linux on z Systems).
This model is stored in a database and is used to identify out-of-the-ordinary messages and
patterns of messages.
Using a sliding 10-minute interval that is updated every two minutes, a current score for the
interval is created based on the uniqueness of the message traffic:
A stable system requires a lower interval score to be marked as
interesting or rare.
An unstable system requires a larger interval score to be marked as interesting or rare.
For each interval, IBM zAware provides details of all of the unique and unusual message IDs
within the interval. This data includes how many, how rare, and how much the messages
contributed to the intervals score (anomaly score, interval contribution score, rarity score, and
appearance count) when they first appeared. IBM zAware also helps in identifying messages
with the following conditions:
Whether the unusual message IDs are coming from a single component
Whether the message is a critical z/OS or Linux kernel message
Whether the messages are related to changes, such as new software levels (operating
system, middleware, and applications) or updated system settings and configurations