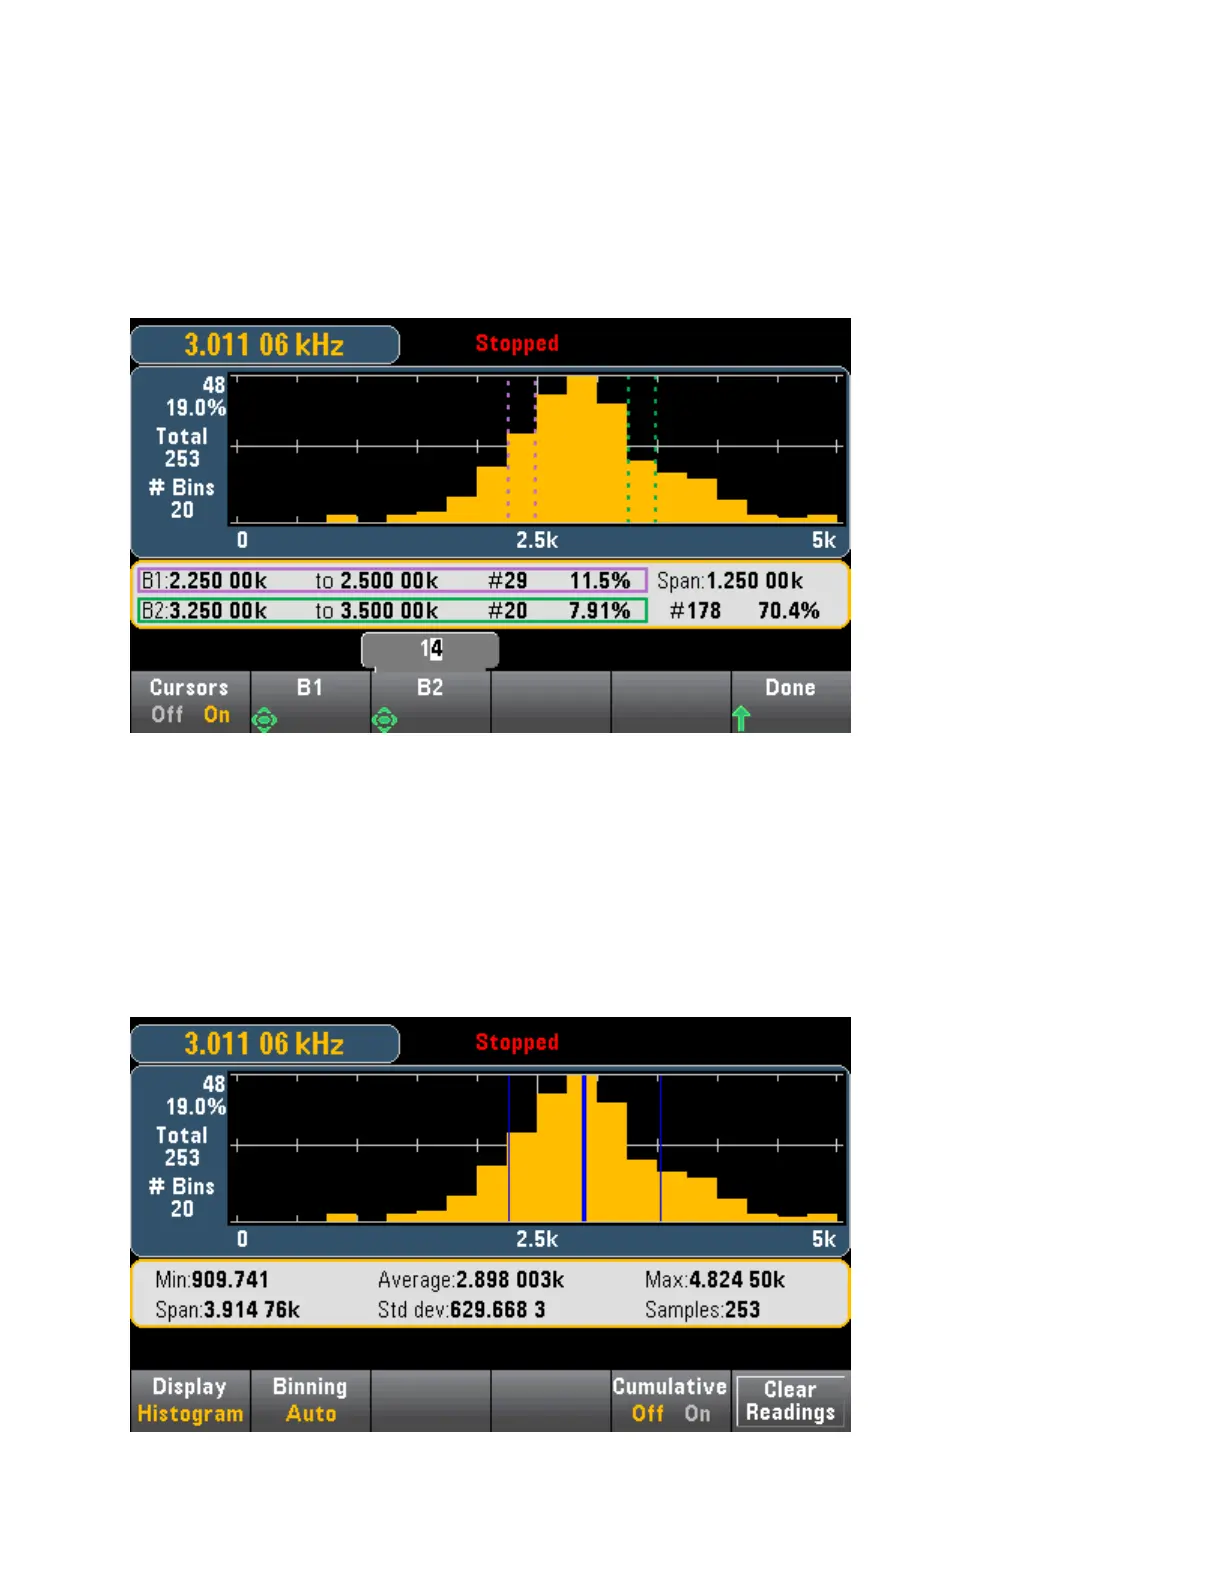
The data between the B1 and B2 cursors, including the data in the B1 and B2 bins, is shown to the right of
the violet and green boxes. In the graphic below:
l
Span: - The measurement range covered from B1 to B2.
l
#178 - The number of samples from B1 to B2.
l
70.4% - The percentage of the total number of samples from B1 to B2.
When Outer Bins are shown (when using manual binning) a zero cursor value indicates the outlier count
below the histogram range, and one plus the number of bins indicates the outlier count above the his-
togram range.
Histogram with Statistics
Showing statistics (Shift > Math > Statistics) is particularly useful for the histogram display. For example,
in the graphic below, the thick blue line is the average, each thin blue line represents one standard devi-
ation from the average.
Features and Functions
136
Keysight Truevolt Series Operating and Service Guide