Lynx
®
NGT-9000
Pilot’s Guide2-72
Operation - Panel Mount
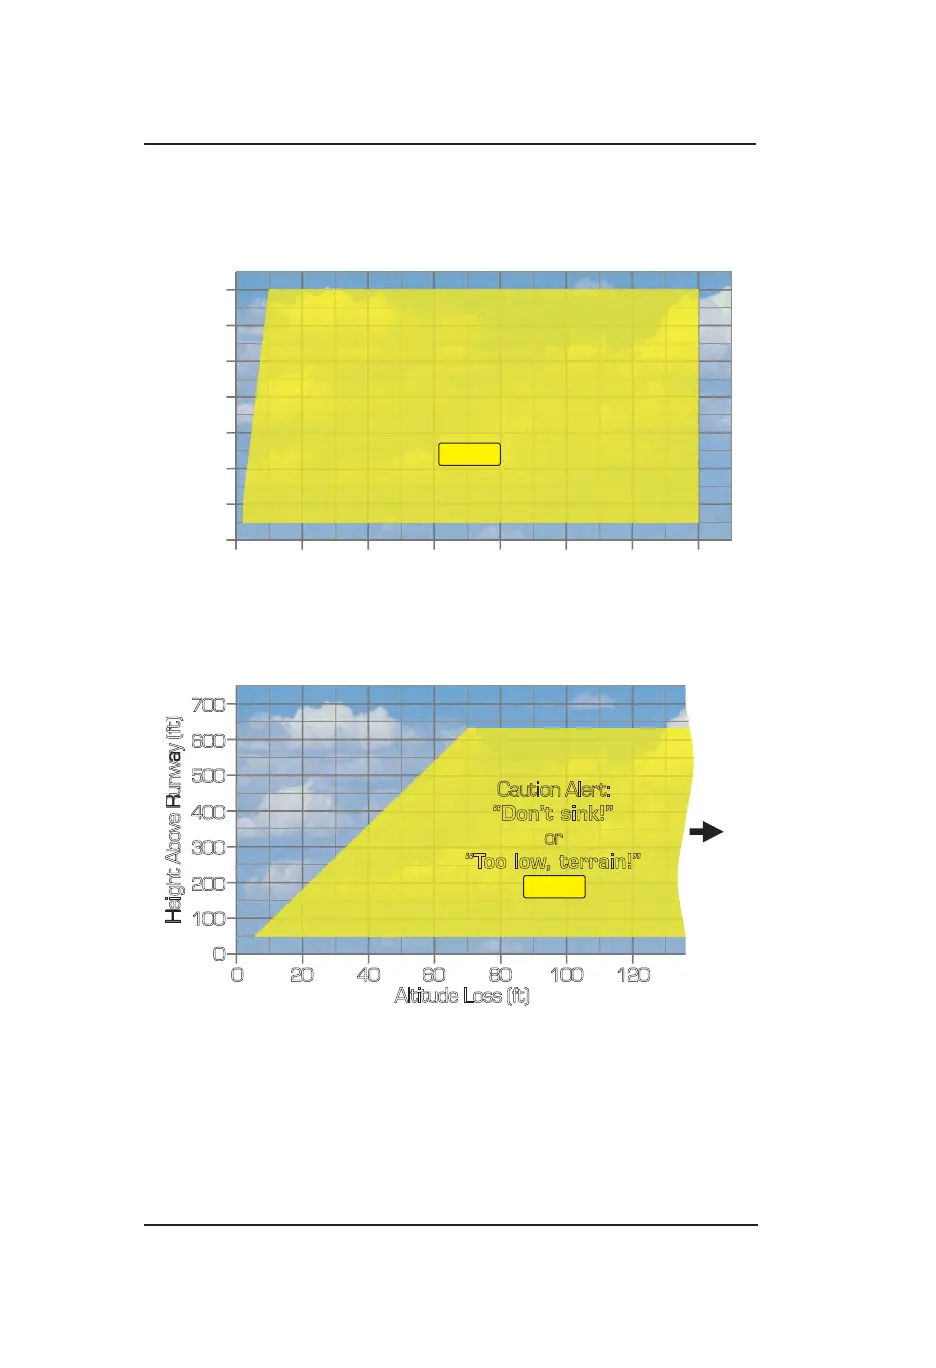
When the aircraft’s height above the runway elevation and its descent
rate or altitude loss fall within the envelopes shown in gures 2-38 and
2-39, TAWS issues a caution alert.
Figure 2-38 Negative Climb Rate Graph
Figure 2-39: Altitude Loss After Takeoff Graph
600
500
700
400
300
200
100
1,000 2,000 3,000 4,000 5,000 7,0006,0000
0
Height Above Runway (ft)
Descent Rate (fpm)
Caution Alert:
“Don’t sink!”
or
“Too low, terrain!”
TERRAIN
600
500
700
400
300
200
100
20 40 60 80 100 1200
0
Height Above Runway (ft)
Altitude Loss (ft)
Caution Alert:
“Don’t sink!”
or
“Too low, terrain!”
TERRAIN

 Loading...