© Microhard Systems Inc. 29
4.0 WebUI Configuration
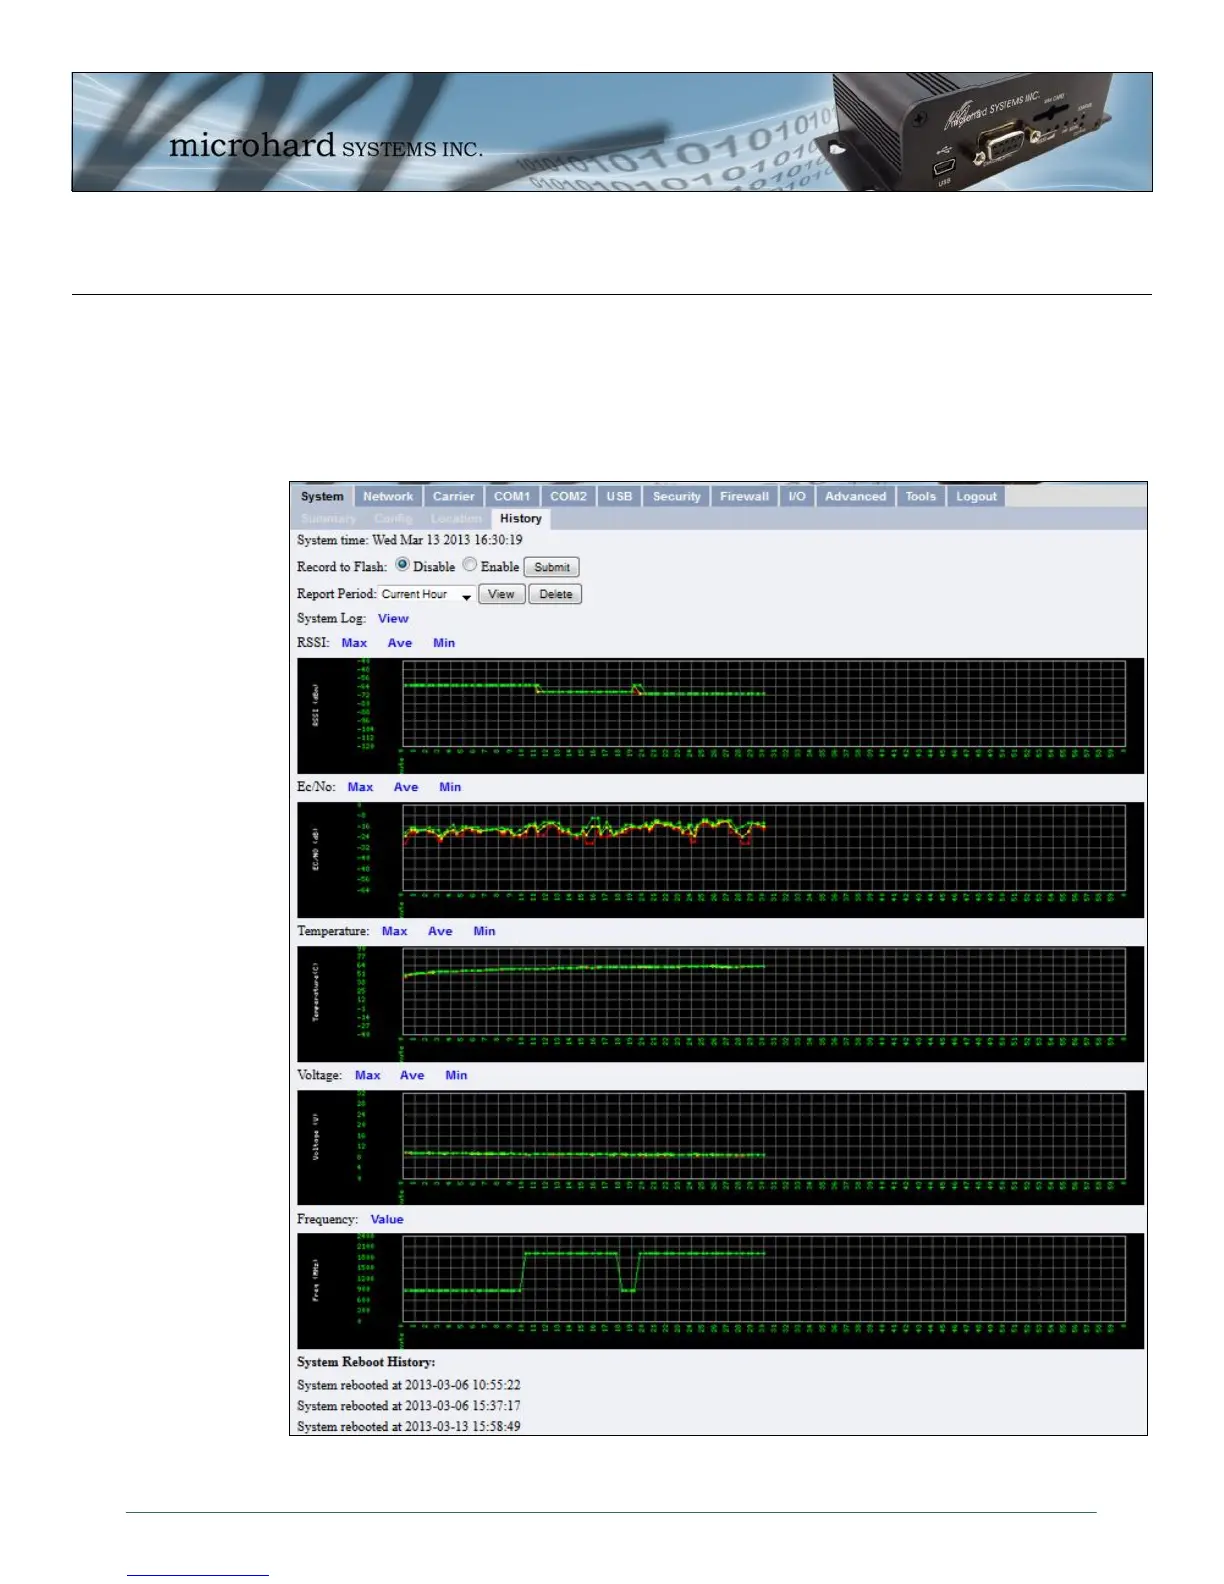
4.2.4 System > History
The History menu shows a graphical history of RSSI, Ec/No, Temperature, Voltage and Frequency of the
Cellular module. Data for the current hour, as well as a specific 24 hour period of a calendar date. Clicking
the Max, Ave and Min links will show the raw data used to plots the points on the graphs. The data points
are optionally stored in non-volatile (flash) memory, so data is saved even when the IPn3G is restarted or
power is lost.
Image 4-7: System > Location