© Microhard Systems Inc. 43
4.0 WebUI Configuration
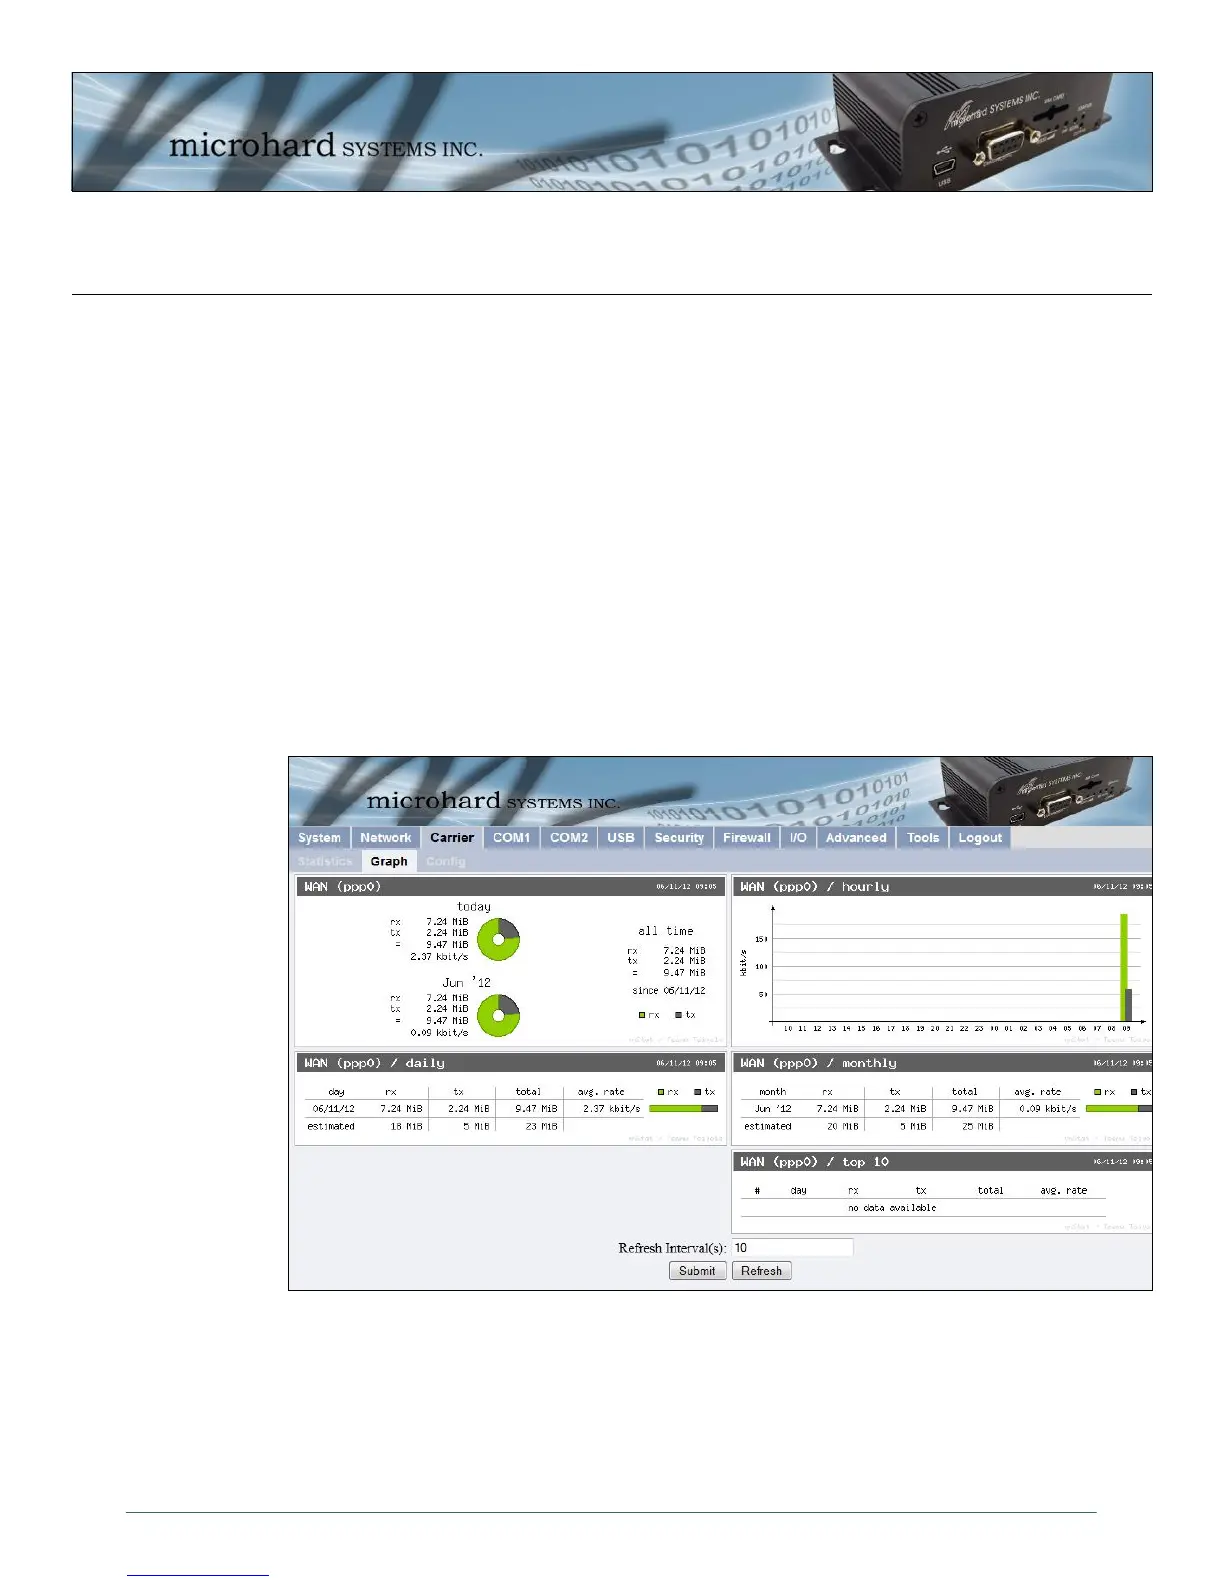
Image 4-18: Carrier Graph
4.4.2 Carrier > Graph
The Carrier > Graph tab displays a graphical display of the Carrier Traffic on the Wireless interface of the
IPn3G.
WAN (ppp0) Shows an overview of all data sent or received by the IPn3G on the Wireless
portion of the unit. A summary of the data of the current day and the current
month is shown.
WAN (ppp0) / hourly Shows the traffic volumes (TX = green, RX = grey) at hourly intervals during
the current 24 hour period. This could be useful to see when the most or least
amount of traffic is present.
WAN (ppp0) / daily Shows the total data received and transmitted for the day, as well as the
average rate of data.
WAN (ppp0) / monthly Shows the total data received and transmitted for the current month, as well as
the average rate of data.
WAN (ppp0) / Top 10 Show the top 10 days with the most data sent or received.