OMNIScanner User Guide
6 - 4
Use or to select which end, OMNI
Scanner
or OMNI
Remote,
you want to view the results for.
Press to open the TDNXT screen.
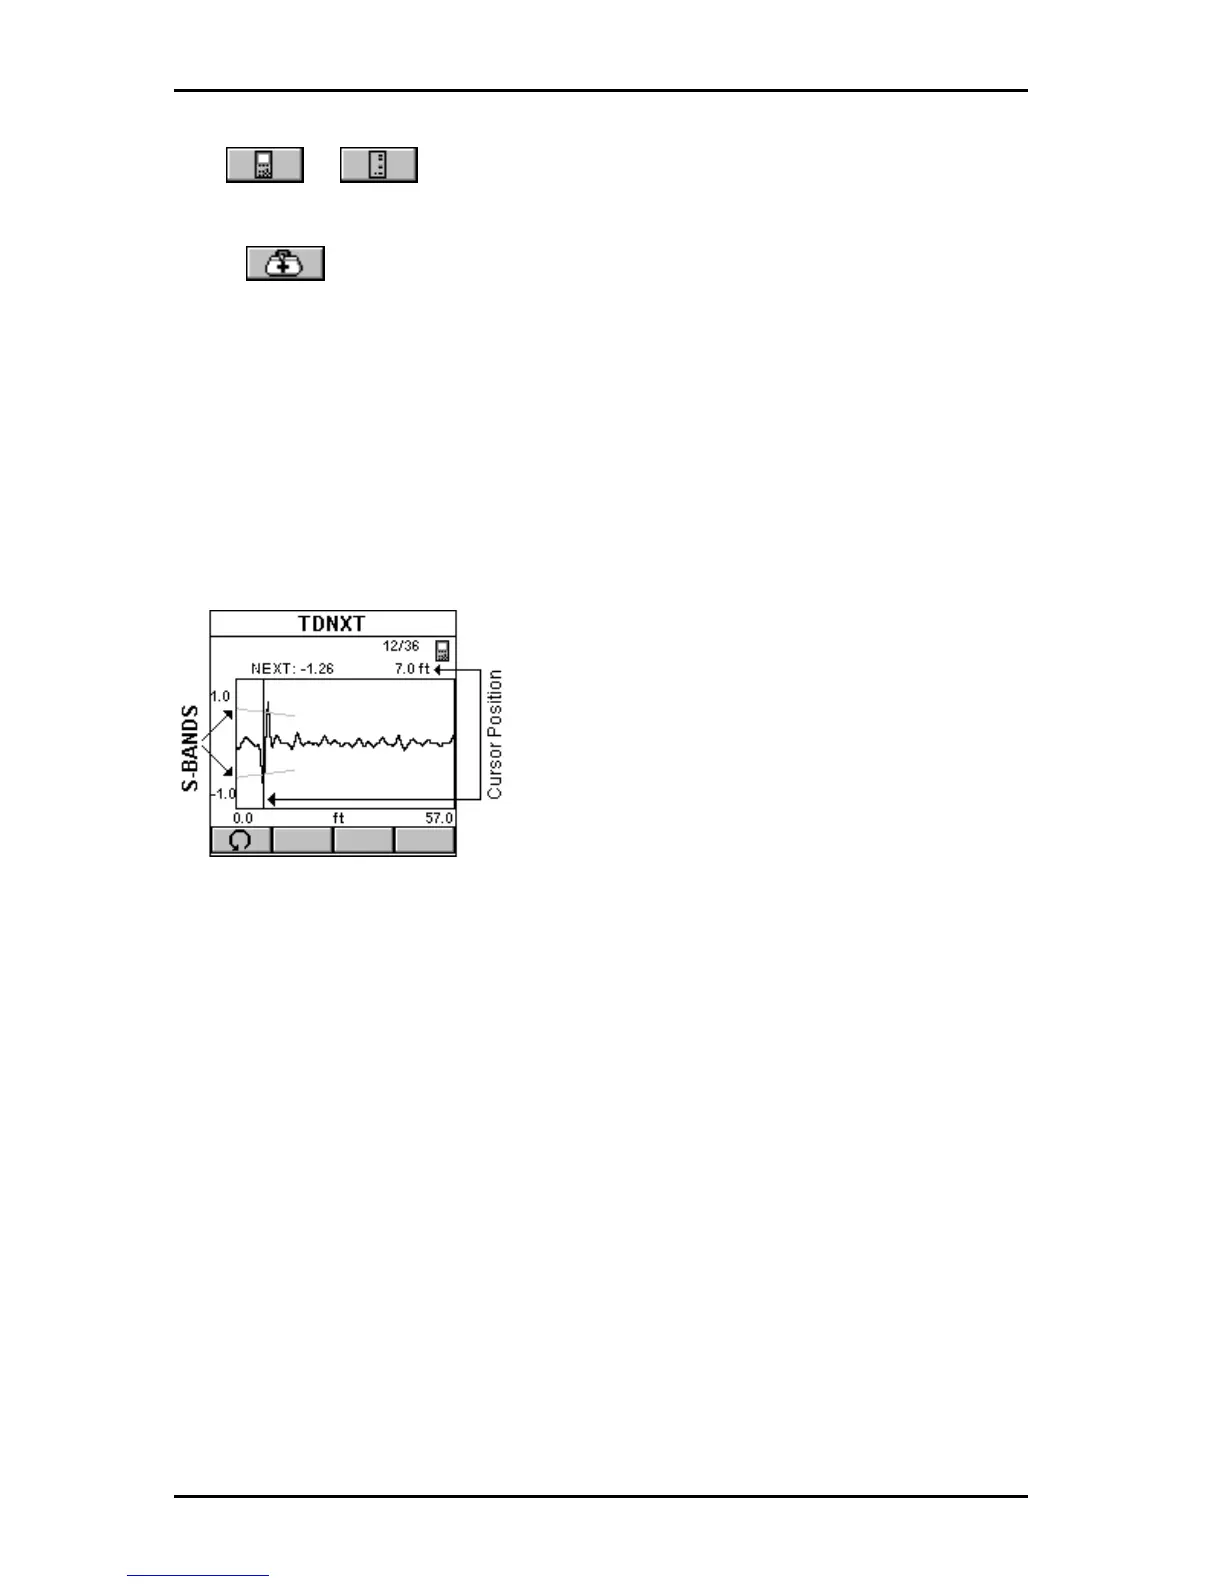
The screen displays the TDNXT (Time Domain NEXT) graph. The funnel-
like lines are the upper and lower S-Bands. S-Bands are limit lines for
connections as a function of distance from the cable end. They provide a
quantitative measure of the NEXT at the connection point, which is typically
located at the end of the test cable at 2 meters (7ft). The measurement unit
for the horizontal graph can be displayed in meters (m) or feet (ft.).
(See
Chapter 4 - Setup: User Options for further information about units.)
Initially, the cursor is located at the point with the worst NEXT.
The NEXT at the cursor position relative to
the S-Band, the corresponding pair
combination, and the distance to the
cursor position are displayed above the
graph.
The example shows a Time Domain
NEXT that exceeds the S-Bands. The
worst NEXT is displayed at 7ft, the con-
nection location. The conclusion is that the
connection caused the failure.
Press ESC to exit the TDNXT screen.
Using TDNXT to Diagnose a Link
The S-Band limit lines provide an easy method to pinpoint faults located at
the connection or the cable. S-Bands allow you to determine if the connec-
tions in a link meet the desired performance level. They are designed to
match the standard category of the selected Autotest.
A graph containing peaks that are located outside the S-bands at the
connection distance indicates that the connection and not the installed
cable is the most likely reason for failure.
If NEXT failed but the TDNXT graph displays peaks within the S-Bands at
the connection distance, the fault is caused by the cable portion of the link.