6 - 5
OMNIScanner User Guide
If failures occur at both ends of the link, use or to diagnose
each end. Failures at both ends of the link can interact.
TDNXT Examples
The following examples show the diagnostics process that is performed to
identify failures on typical links with 2 meter test cables.
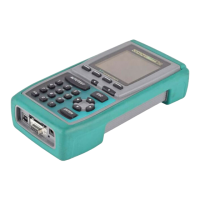
GOOD CABLE, BAD CONNECTION:
The cursor in the NEXT graph is located at the
worst NEXT at 144.0 MHz, which is outside the
limit line. (For display purposes the cursor is
moved.) The Link failed. Why?
Press to open the TDNXT screen to
further review and diagnose the graph.
The cursor is positioned at the worst peak, which
is outside the S-Bands.
Looking at the TDNXT graph we can reach the
conclusion that the connection located at 2
meters did not meet the required performance
and is the cause of failure.
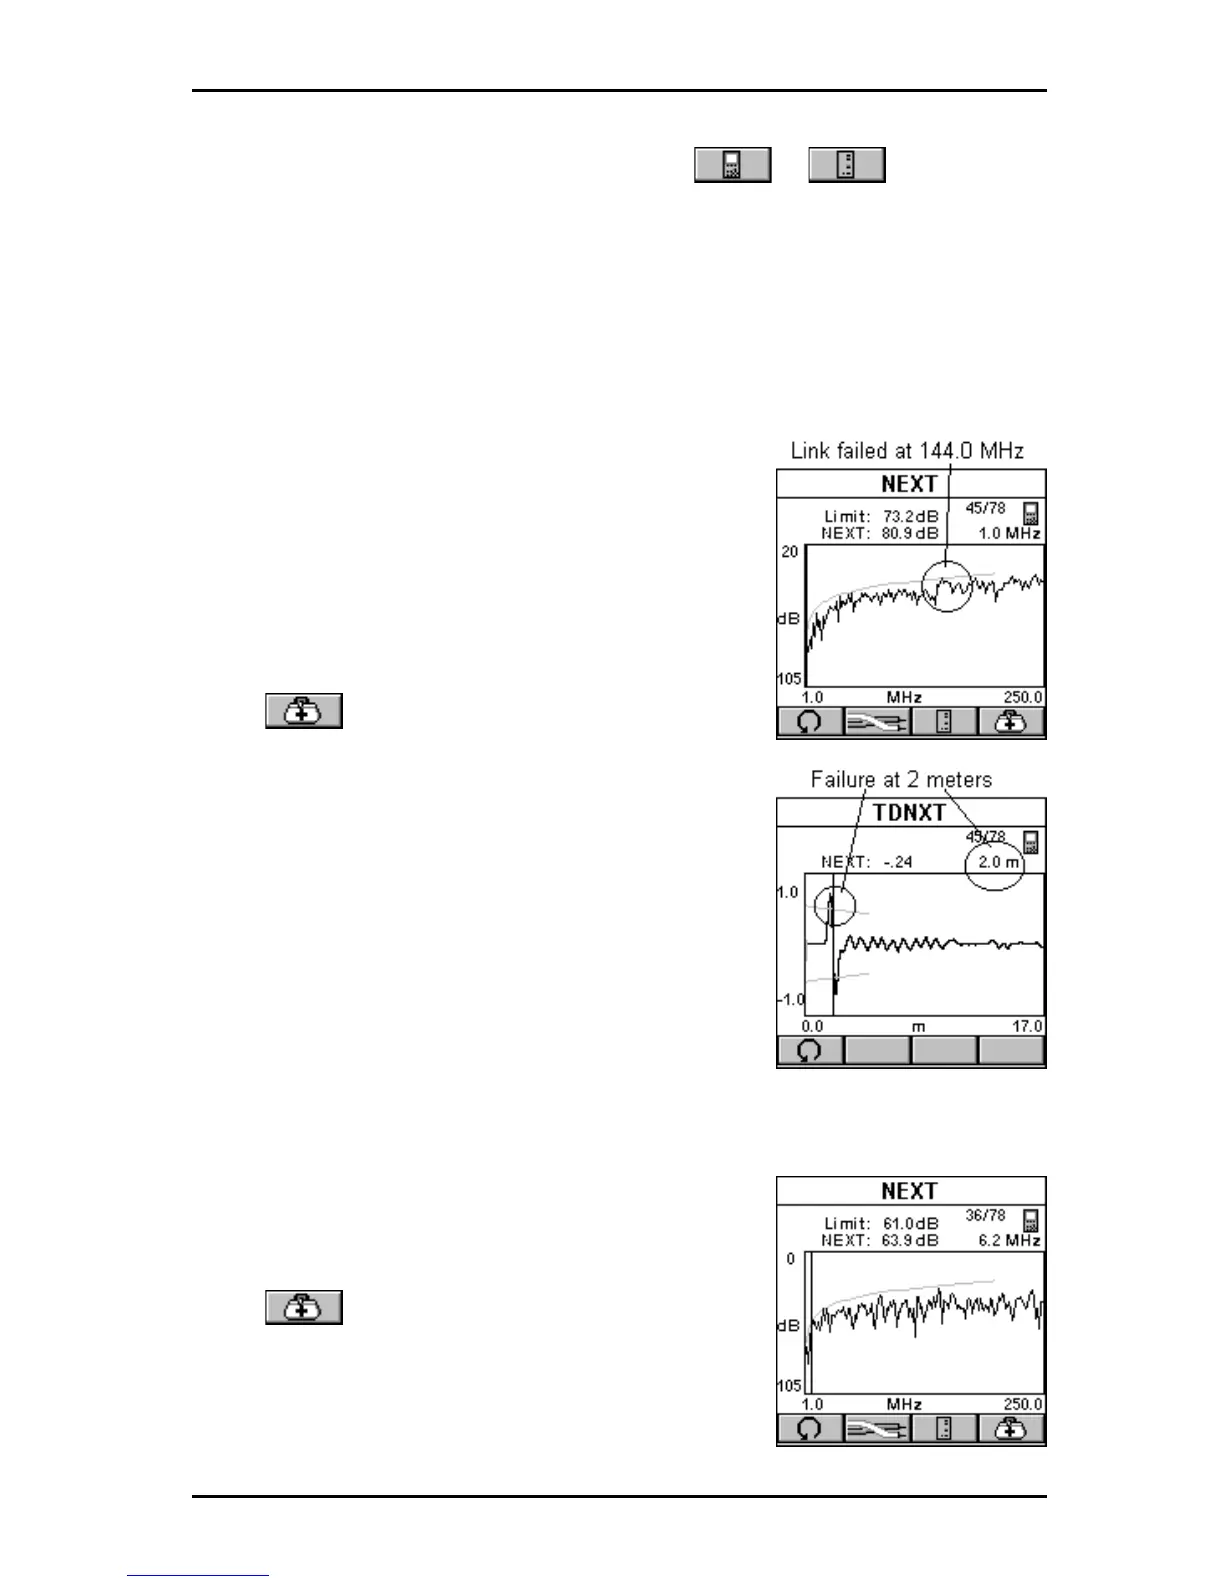
BAD CABLE, GOOD CONNECTION:
The cursor in the NEXT graph is located at the
worst NEXT at 6.2 MHz, which is outside the limit
line. (For display purposes the cursor is moved to
the Zero-position.) The Link failed. Why?
Press to open the TDNXT screen to
further review and diagnose the graph.
The NEXT response from the connector located
at 2 m is well within the S-Bands and performs
significantly better than the requirements. The