OMNIScanner User Guide
5 - 8
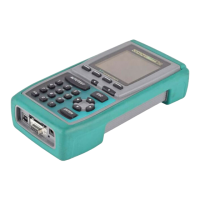
The pairs are displayed in the column on the left side, followed by the
Attenuation in decibels (dB), the Attenuation margin/limit values, and the
frequency. The result for each pair is tagged with a PASS , Marginal
PASS , Marginal FAIL , or FAIL indicator.
Press (Graph) to display the Attenuation
graph for the highlighted pair. The Attenuation is
displayed for the frequency indicated by the cursor
position.
Press (Pairs) to view Attenuation results for
other pairs.
Press ESC to exit the ATTENUATION screen.
Note: Attenuation always reports the worst dB value regardless of the
Report: setting in the RUN OPTIONS screen.
Return Loss
The Return Loss function measures the uniformity of a cable’s impedance.
OMNI
Scanner
injects a signal into the cable and measures the reflected
signal strength. Return Loss measures the difference between the transmit-
ted signal delivered to the cable and the reflected signal at the input port of
the cable. The reflected signal is the result of impedance mismatches in the
link under test.
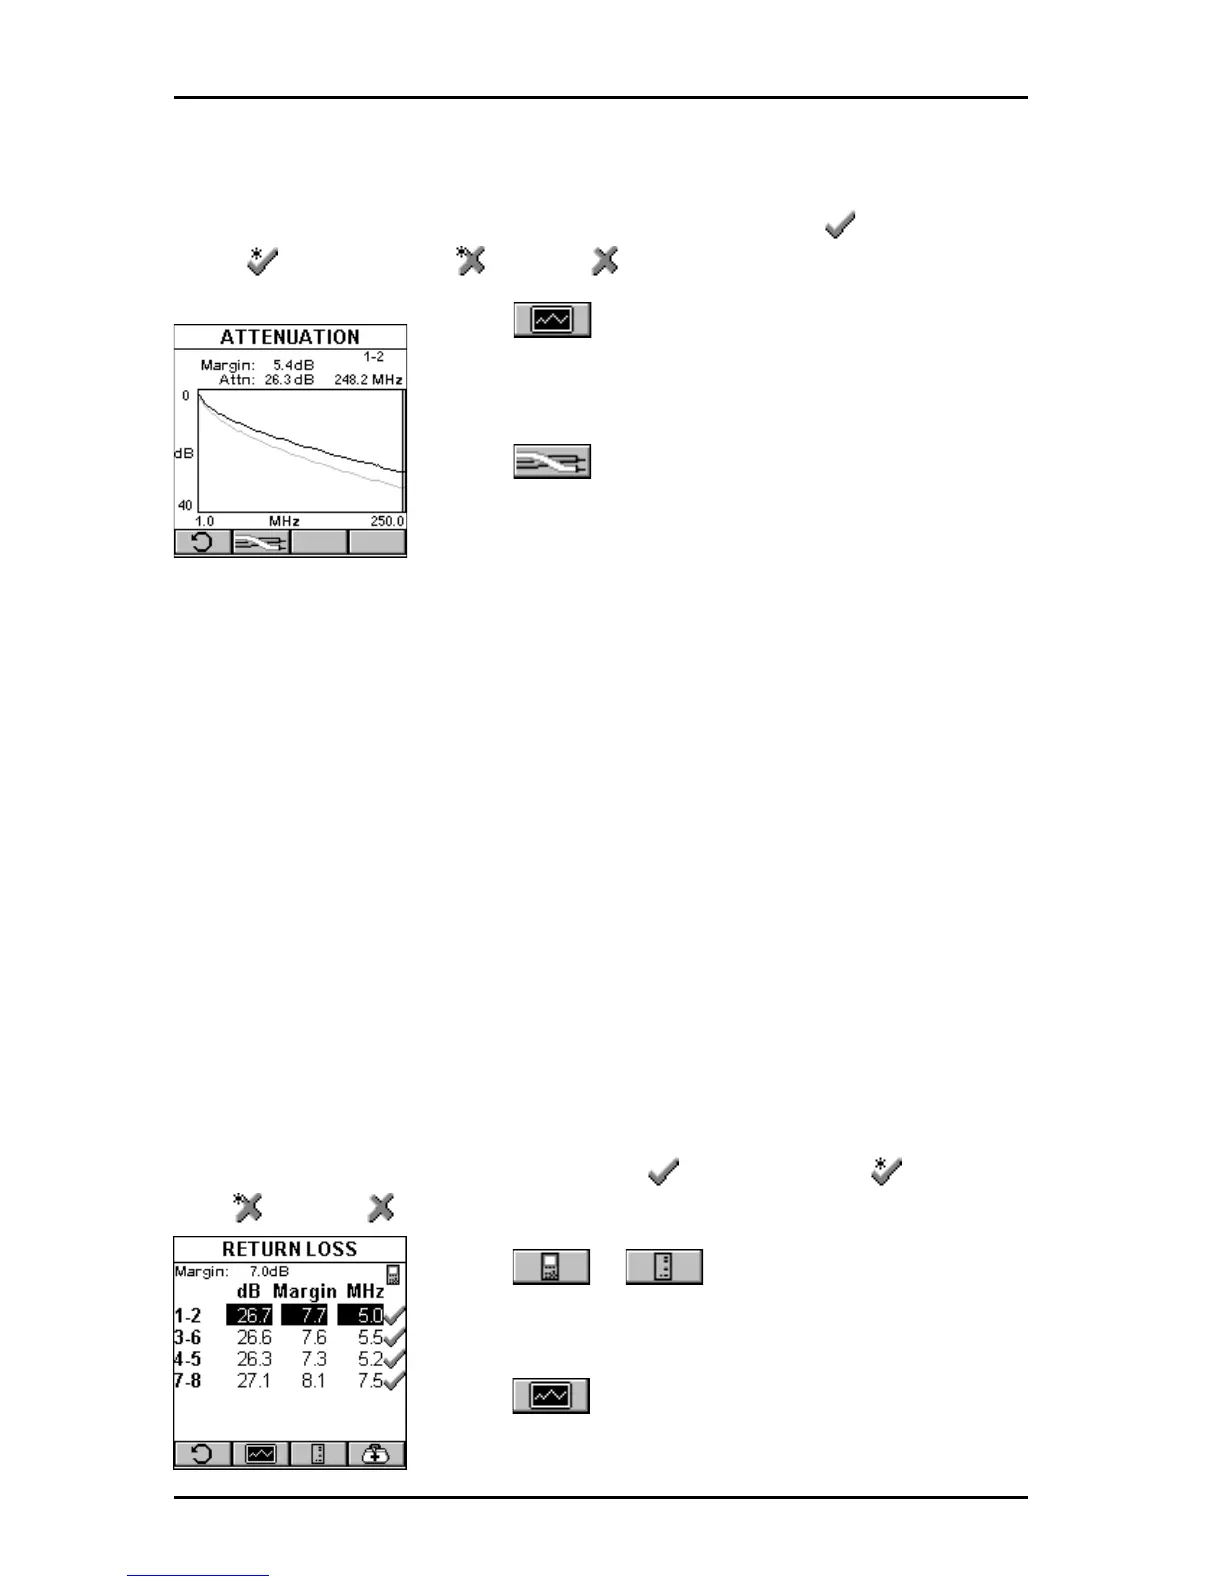
In the RETURN LOSS screen, the worst case margin for all near and far
pairs is shown at the top of the screen.
The pairs are displayed in the column on the left side, followed by the Return
Loss in decibels (dB), the Return Loss margin/limit, and the frequency. The
result for each pair is tagged with a PASS , Marginal PASS , Marginal
FAIL , or FAIL indicator.
Press or to toggle between the
Return Loss results for OMNI
Scanner
and
OMNI
Remote
.
Press (Graph) to display the Return Loss
graph for the highlighted pair. The Return Loss is