4-9
Select [MRN] or [Name] to select the desired patient.
Select [
Interval] to set the interval for the data to be displayed.
Select the page key (for example ), and then use up or down arrow
beside the key to turn the page.
Select [Print] to print the trend data of selected patient.
Select [
Delete All] to delete the trend data of selected patient.
Parameter value triggering high level alarm has a red background; parameter value
triggering medium or low level alarm has a yellow background.
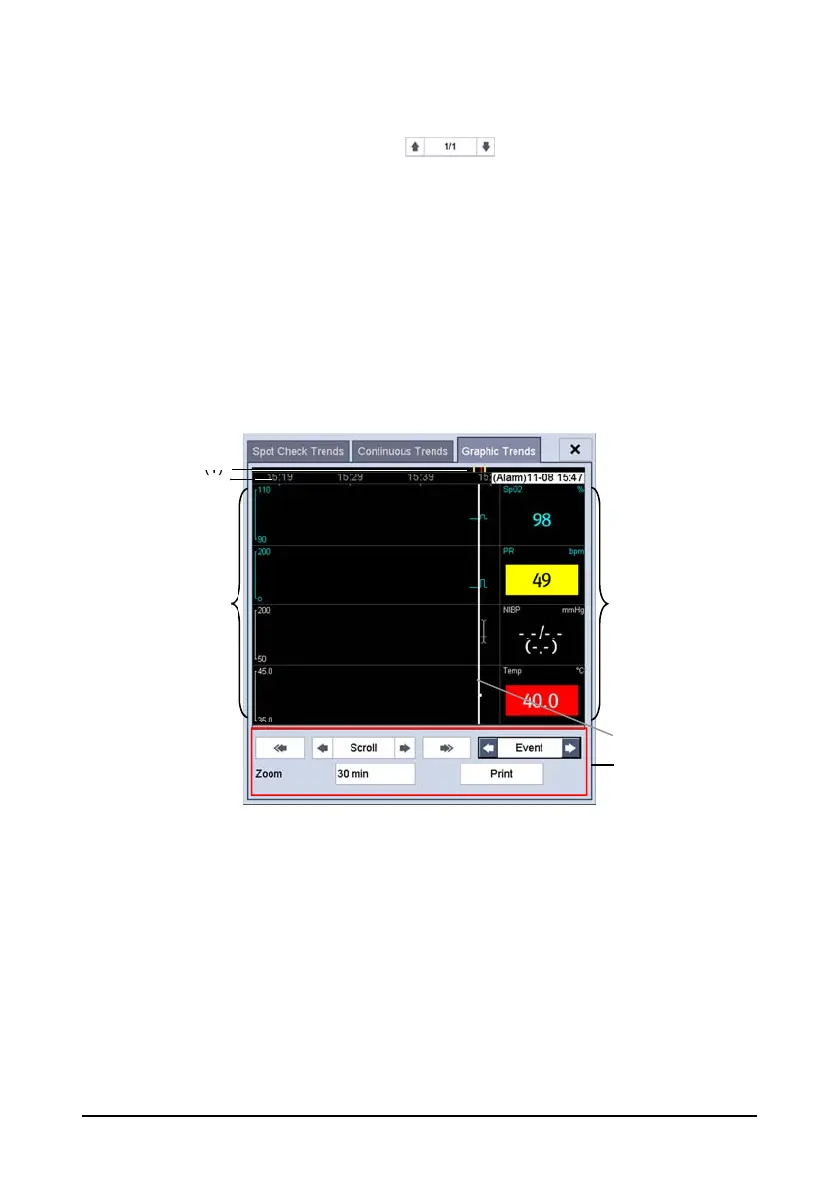
4.4.3 Graphic Trends
Select [Graphic Trends] tab to access the Graphic Trends screen. The Graphic Trend
screen displays the current patient's physiological trend.
(1) Event mark area (2) Time scale (3) Graphic area
(4) Parameter area (5) Cursor (6) Button area
A timestamp indicating your current position is displayed above the parameter area. The
parameter value corresponding to the cursor time appears in the parameter area. The
measurement value that triggered a high level alarm has red background. The
measurement that triggered the medium/low level alarm has a yellow background.
Events are marked with colors in the event mark area. Red represents a high level alarm
event. Yellow represents a medium/low level alarm event.
In the Graphic Trends screen, you can:
(1)
(2)
(4)
(3)
(5)
(6)
 Loading...