Chapter 7. Performing Measurements
145
Fig. 7-129
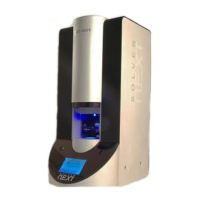
Grid – spectroscopy will be taken at vertices of a predefined grid. The desired rectangular
area is defined with the mouse. X and Y grid dimensions are defined in corresponding
input fields to the right from the drop-down list (Fig. 7-130).
Fig. 7-130
Custom – measurement parameters can be defined independently for every measurement
point. When this mode has been selected, the
Custom spectroscopy settings table opens
providing access to measurement parameters for those points.
Selecting points for spectroscopy in
Custom
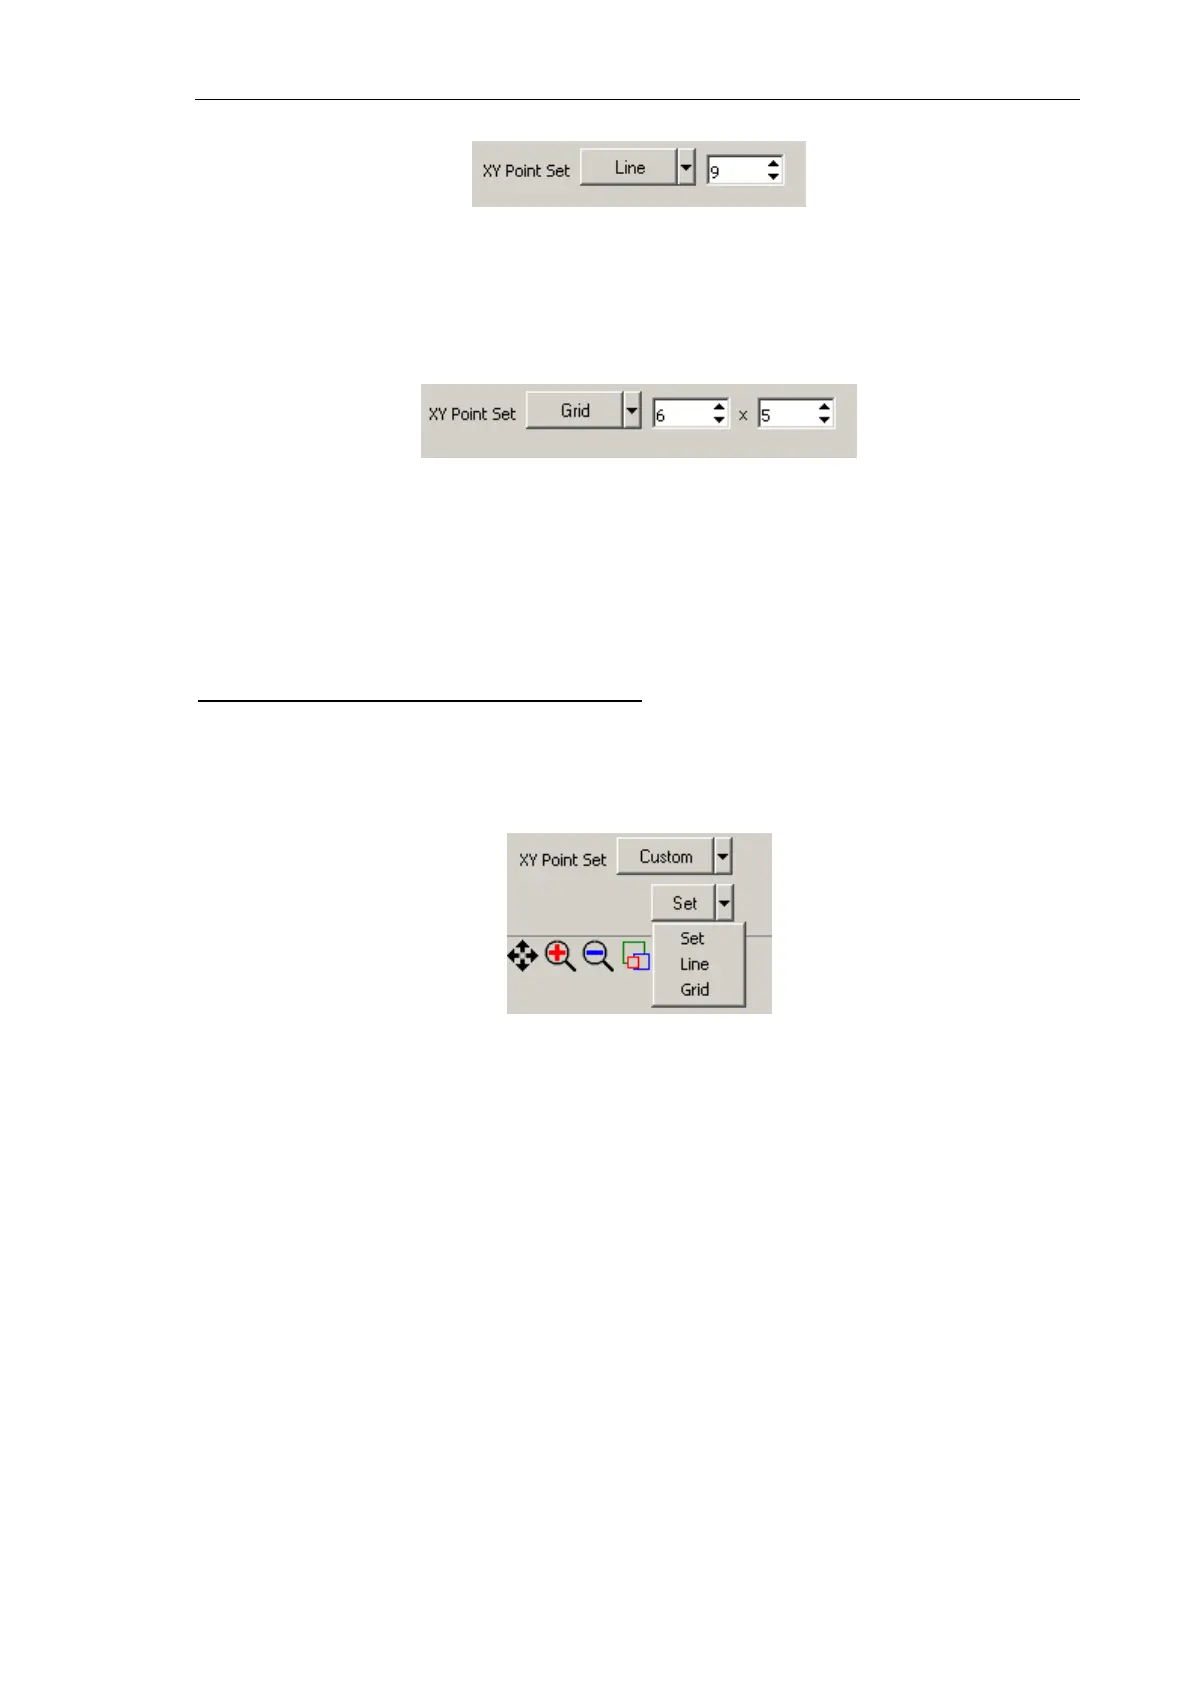
When the Custom mode has been selected, a list of available modes to define the
measurement points is provided below the XY Point Set list (Fig. 7-131).
Fig. 7-131. Available modes to define measurement points in the
Custom
The following modes of selecting points for spectroscopy are available:
Set – a point is selected by clicking with the <Ctrl> key being pressed.
Line (Grid) – points will be distributed along a line (grid) that is defined with the mouse.
Clicking the
Line (Grid) button causes the predefined line (or grid) to be covered with a set
of measurement points.
Every measurement point is attributed with its ordinal that is displayed next to the point
(Fig. 7-132). The measurement points will be investigated according to their ordinal
numbers.