Solver NEXT SPM. Instruction Manual
206
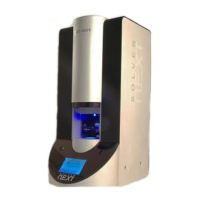
Fig. 8-68. Sample surface after lithography
left – topography; right – surface potential distribution
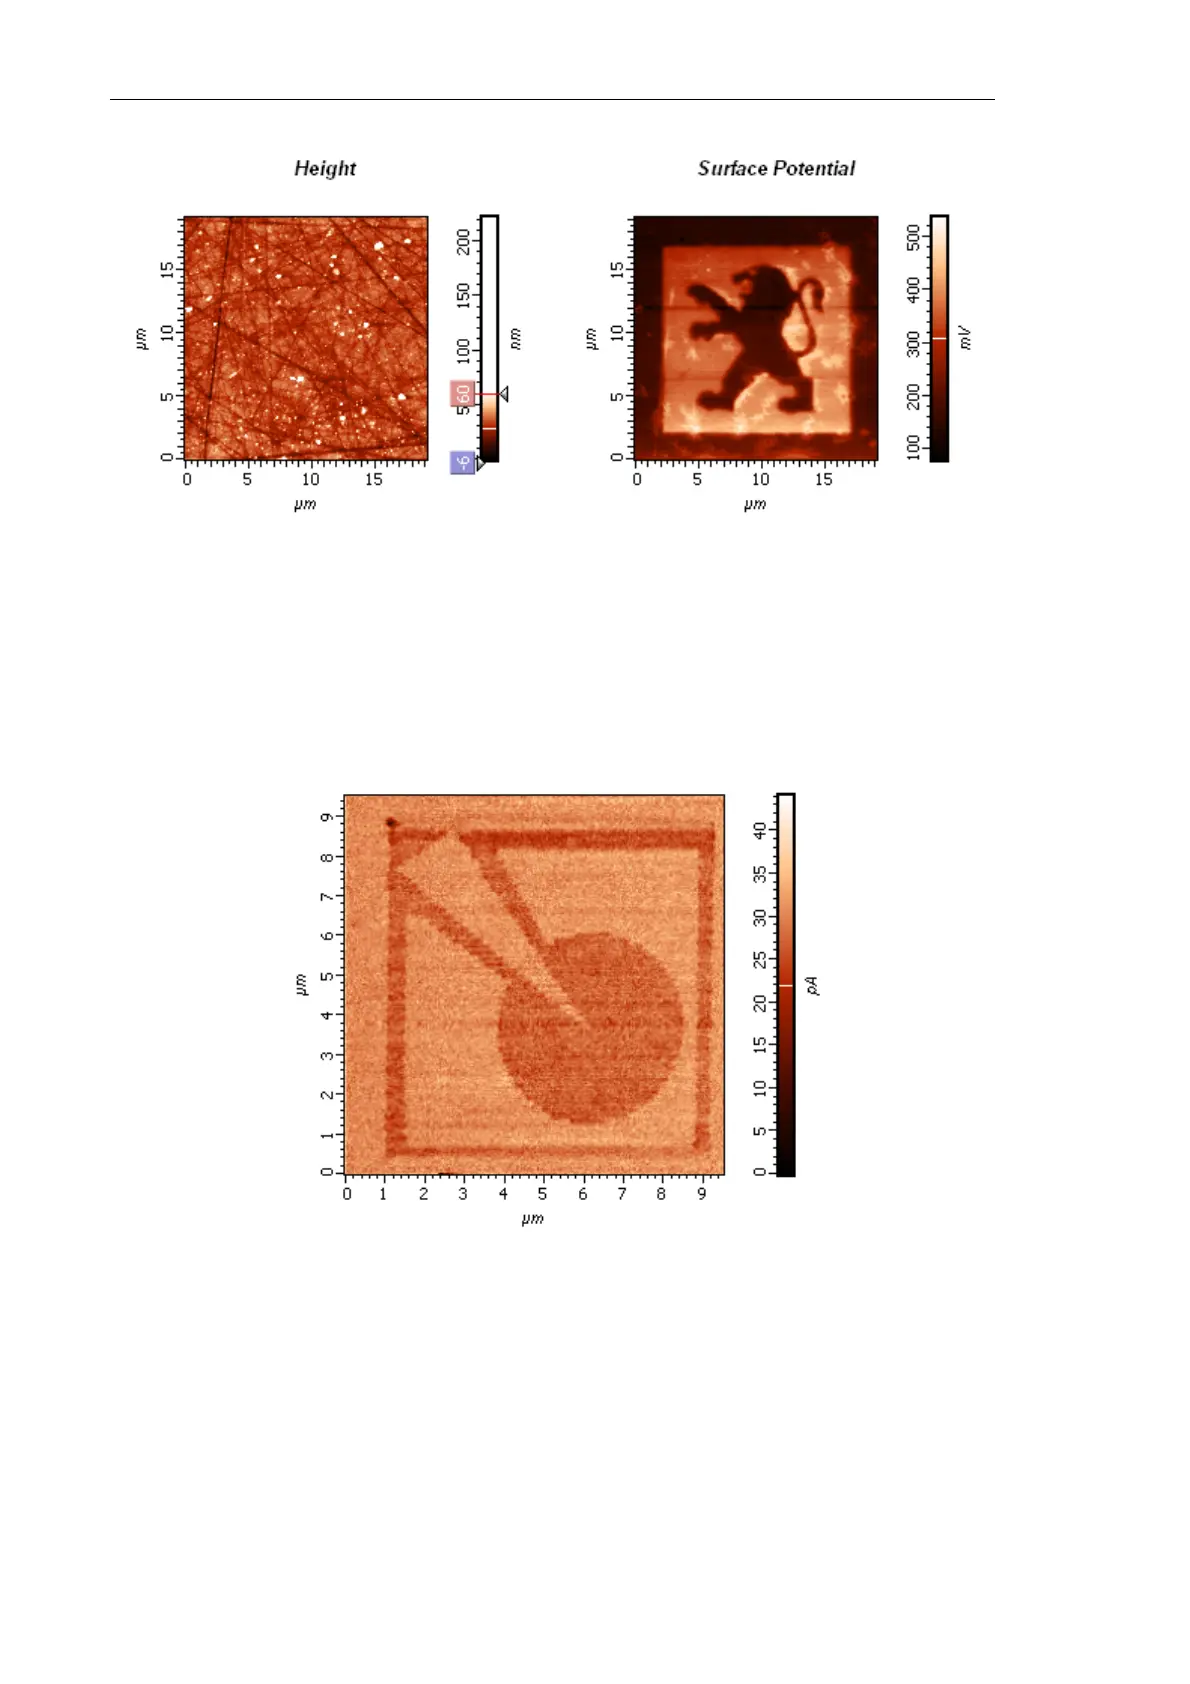
Results of current lithography
Fig. 8-69 shows results of the raster lithography applied to the octadecyltrichliorsylanum
sample with Action 1 = 0.3 nA, Action 2 = 0 nA, by the DСP11 probe.
Fig. 8-69. Sample surface after lithography