4-6
VIBXPERT II 05.2012
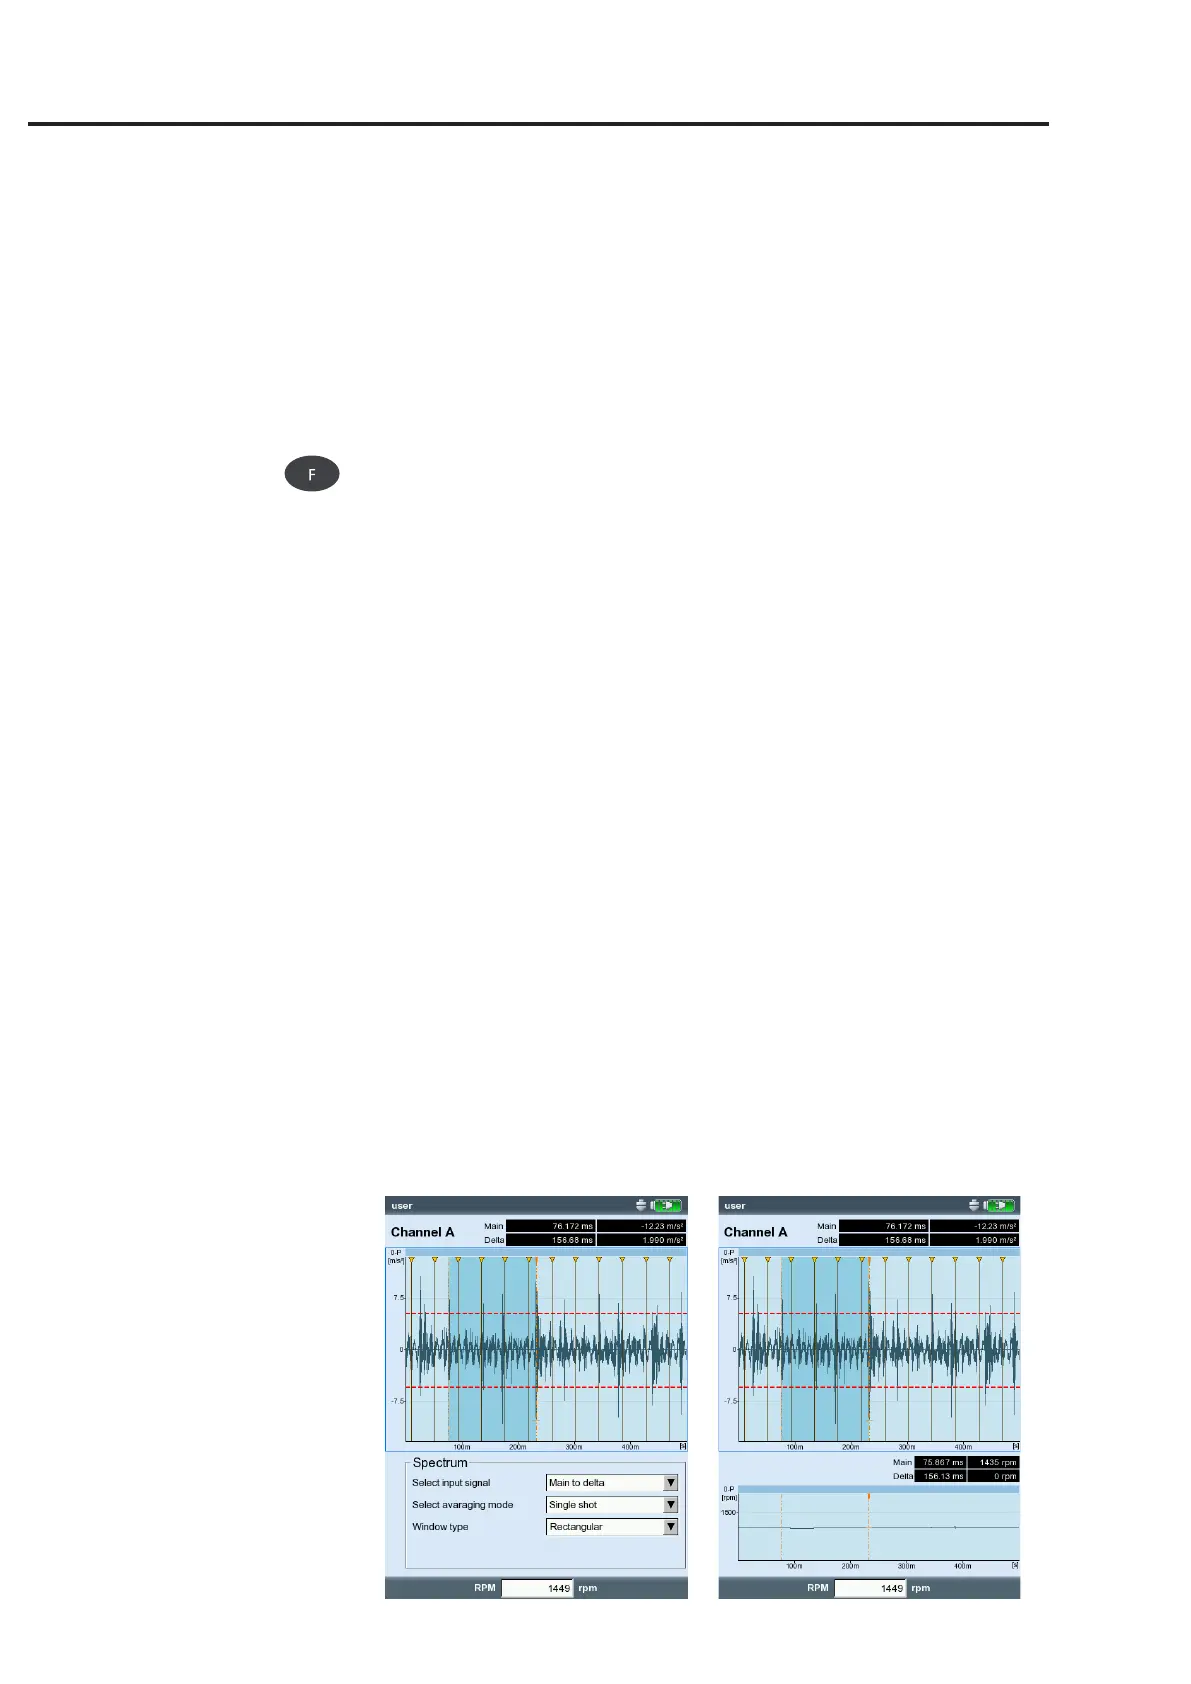
Calculating the spectrum
Based on the time waveform, you can calculate a spectrum that you
can save and measure again.
• PresstheMENUkeyintheresultscreen.
• Select‘Postprocessing’andclickon‘Computespectrum’.
• Settheparametersinthelowerwindowpane(seebelow):
- Input signal
entire signal: the entire signal is used to calculate the spectrum.
visiBle signal: the spectrum is based only on the visible signal.
Zoom the display if required*.
main to delta: Move the cursor to set the interval.
start at main: only the signal from the main cursor is being used.
- Averagingmode:Singleshot/Averaging
- Windowtype:Selecttheappropriatewindowtype(P.3-24).
• PresstheMENUkeyandclickonOK.
The calculated spectrum can be saved and measured again. A trans-
formation is only possible in the Cartesian display.
Displaying the rpm run
If the rpm is recorded alongside the time waveform, you can display
the rpm run as follows:
• PresstheMENUbuttonintheresultscreen.
• Select‘Postprocessing’andclickon'Computerpmsignal'.
The rpm run appears in the lower window pane.
Left:
Calculating the spectrum
from the time wavefrorm
Right:
RPM run during
signal measurement
Results
* Press the F key to switch between the
upper and the lower window pane.

 Loading...