4-5
VIBXPERT II 05.2012
Results
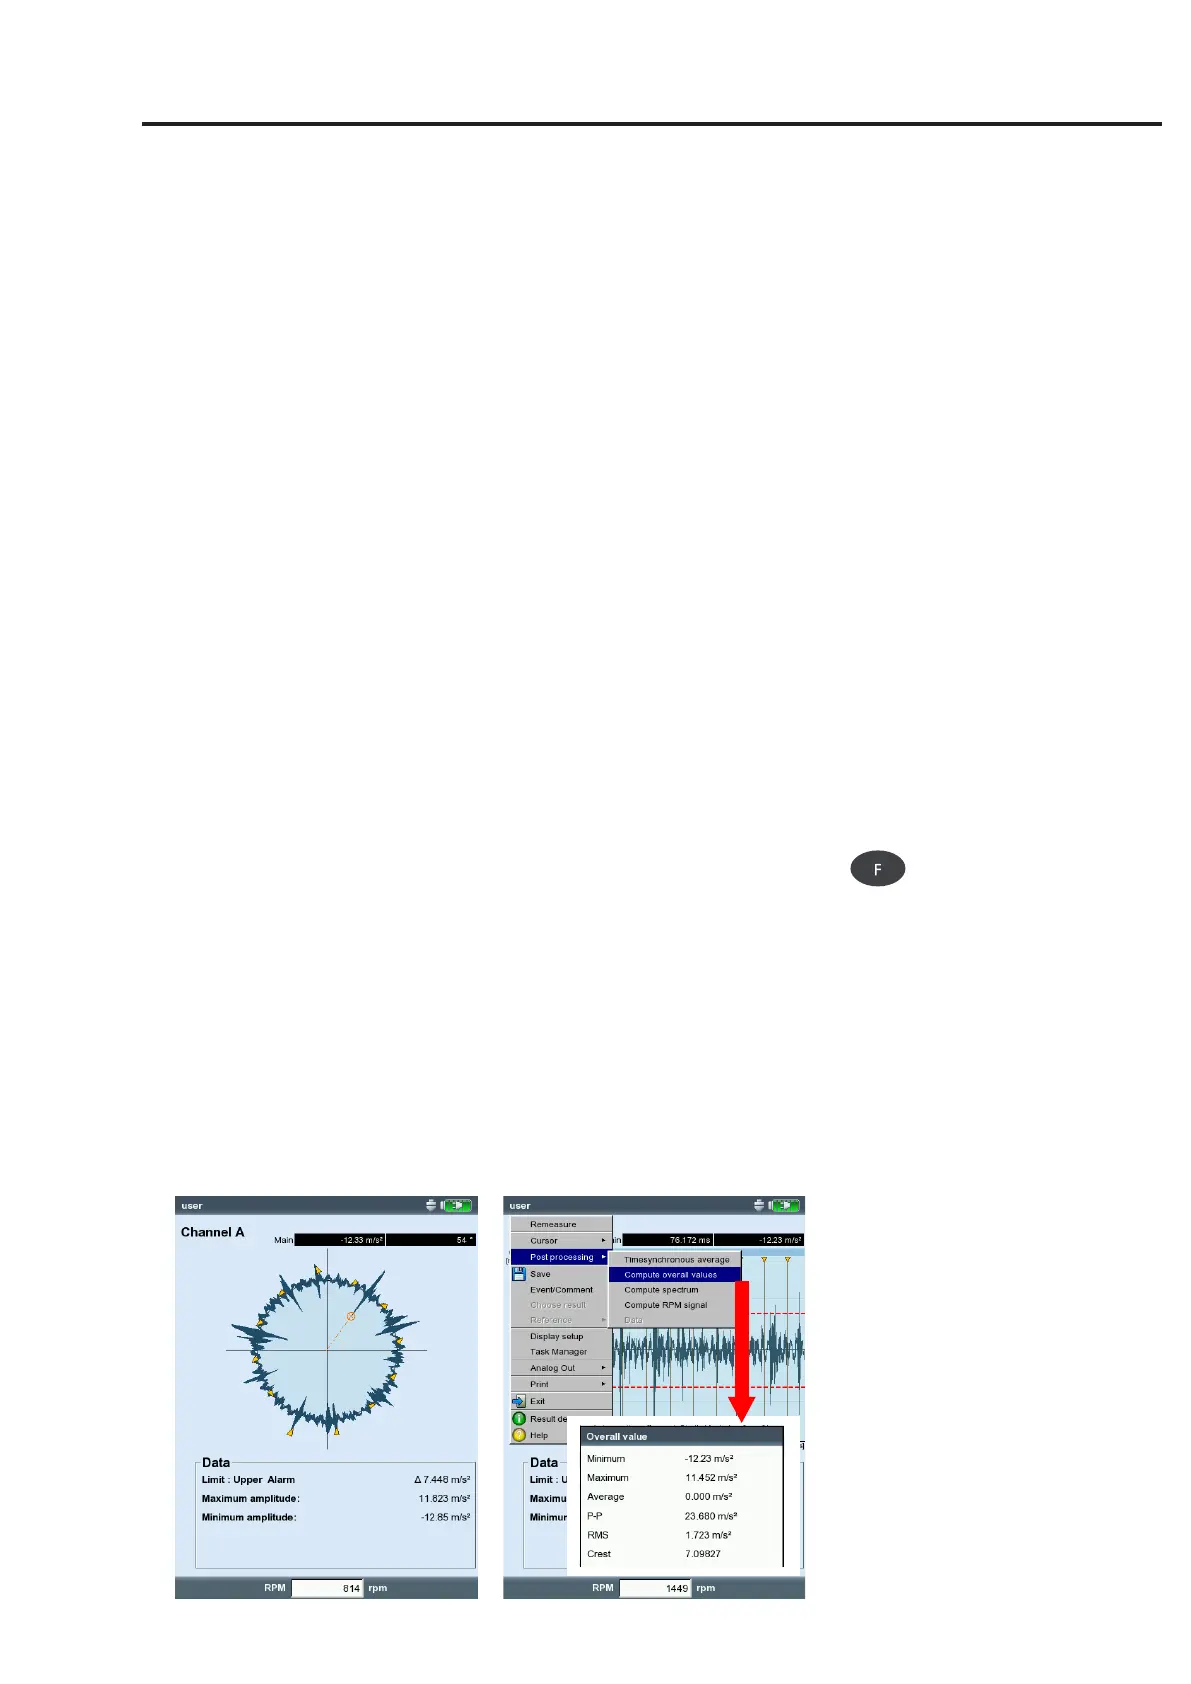
Left:
Time signal in circular plot
Right:
Signal postprocessing
delta:Show/hidedeltacursor
Press 'Enter' to switch over between main and delta cursor. In
this case the measurement can only be repeated via the MENU
key (MENU - 'Remeasure')! The cursor coordinates indicate the
distance to the main cursor. The data field specifies the frequency
which corresponds to the distance between the main and delta cur-
sor (see below).
sideBands:Show/hidesidebandcursor
Selectthenumberofsidebands.Thespacingofthesidebandsisset
by moving the outer cursor*. The position of the entire group can
be changed by moving the middle (main) cursor.
Cartesian / circular plot
By default, the time waveform is displayed in a Cartesian plot (XY
diagram).However,youcanchangethedisplaytoacircularplot.This
is useful when the gear mesh in a gear stage is to be emphasized, for
example. In this type of display, the measured time interval is pro-
jected on a circle, so that the start and end times are directly adjacent
tooneanother.Iftheshaftrotatesby360°withinthemeasuredtime
interval, the circular diagram shows the signal for one complete rota-
tion of the shaft.
• PresstheFkeytotogglethetwodiagramtypes(seebelow).
Signal post processing
Calculating the characteristic overall values from the signal
The following overall values can be calculated:
- Maximum / minimum amplitude,
-Arithmeticmean,p-pvalue,RMSvalue,Crestfactor.
• PresstheMENUkeyintheresultscreen.
• Select‘Postprocessing’andclickon‘Computeoverallvalues’.
* press 'Enter' to switch between the
main and the outer cursor.

 Loading...