4-20
VIBXPERT II 05.2012
Display setup
C2. Display setup for trend: phase
phase over...: When several phase measurements are saved in one file,
the phase vectors can be shown depending on the time or rpm (see
below).
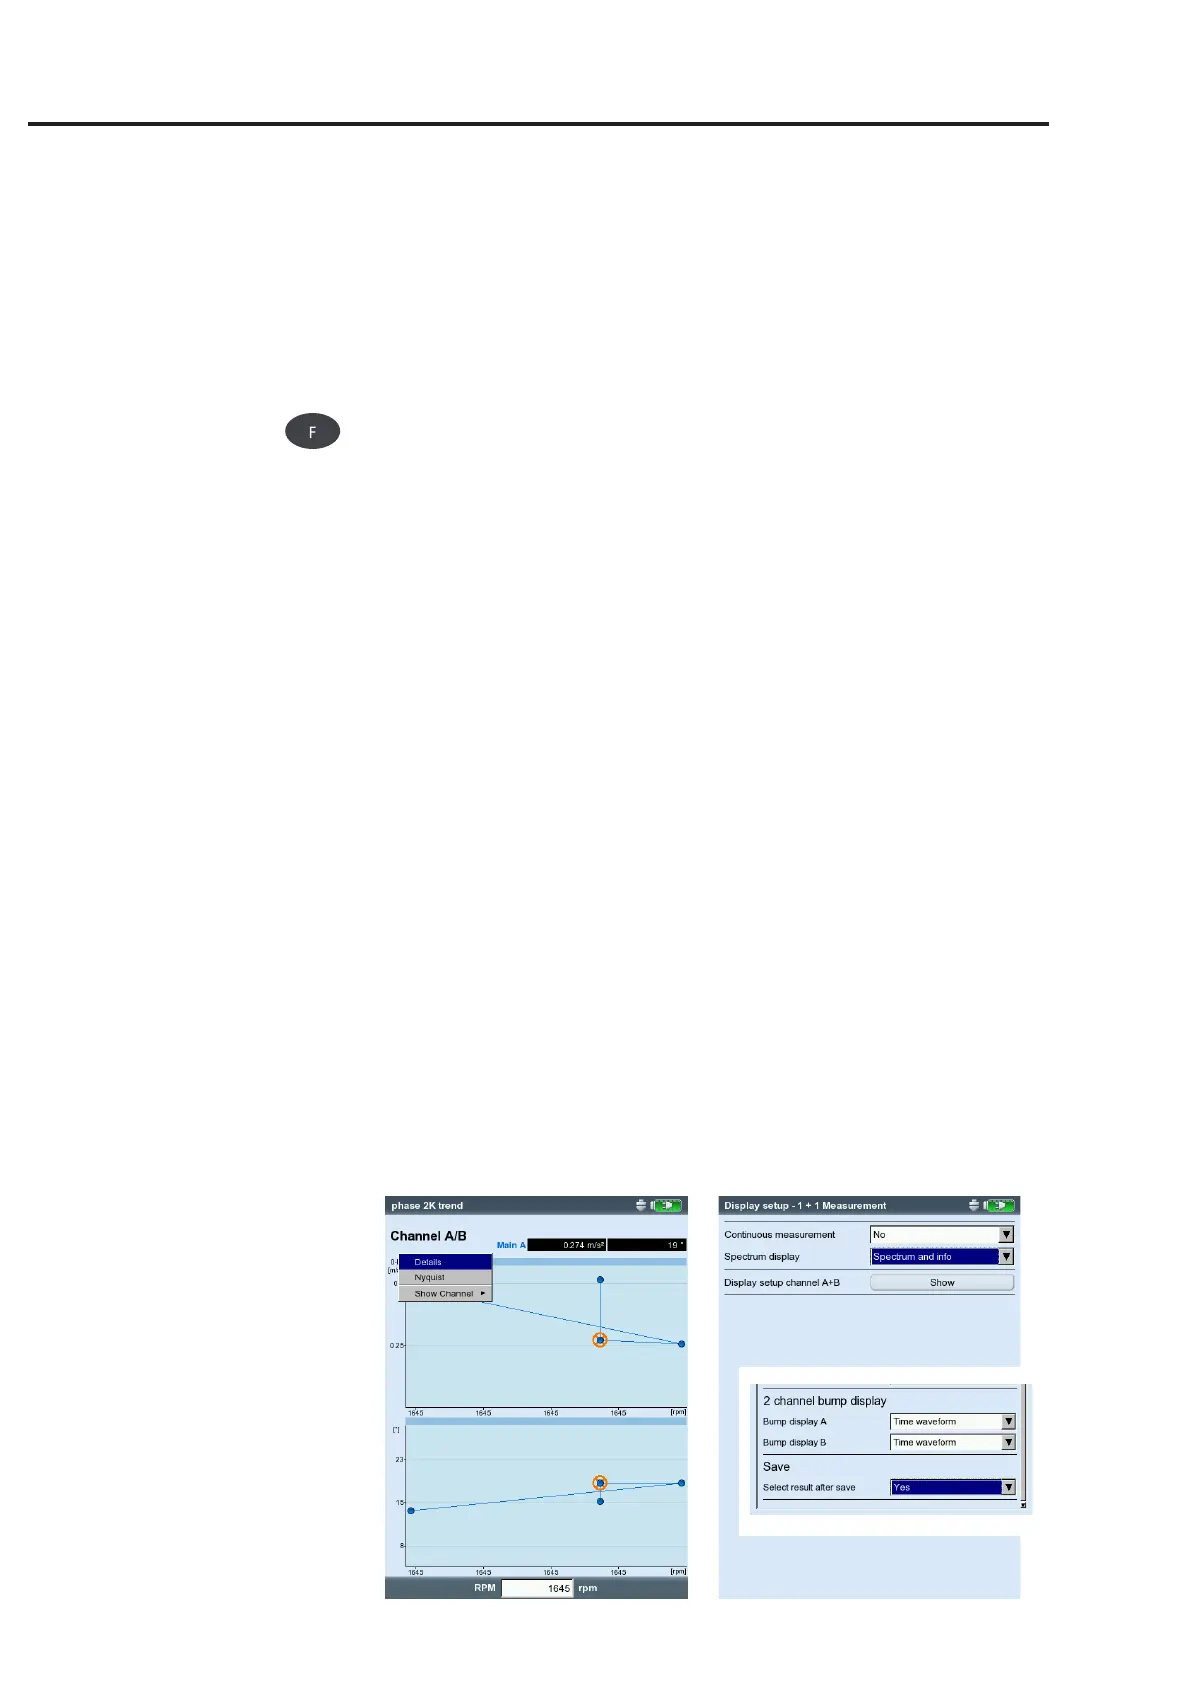
Phase trend diagram
Use the F-key to open a menu in the results screen (see below) with
the following options:
details: Showresultofasinglemeasurement
nyquist / Bode: Change diagram type
show channel: ShowchannelA,channelBorbothchannels.
D. Display setup for measurement: 2-channel measurement (1+1)
spectrum display: If the measurement task contains a spectrum
measurement, you can choose whether only the spectrum, or also
the set additional info (max. 10, time waveform,.. see section B1)
should be displayed.
display setup channel a / B: Click on Show to display the display set-
tings of the individual measurement tasks.
To edit the display settings of the individual measurement tasks,
enable the required window pane in the result screen and call up
thedisplaysetupviatheMENUkey(seediagramonpage5-24).
E. Display setup for measurement: impact test
Bump display: Choose whether the result of the impact test should be
displayed as a time waveform or spectrum.
select result after save: The result selection dialog window opens au-
tomatically (yes) after a measurement is stored.
Left:
Phase trend
Phase vector as a function
of the rpm (see figure) or the time
Right:
2-channel display setup for
1+1 measurement
Impact test

 Loading...