D.2 DEFINITIONS AND FORMULAS OF THE SLM RESULTS
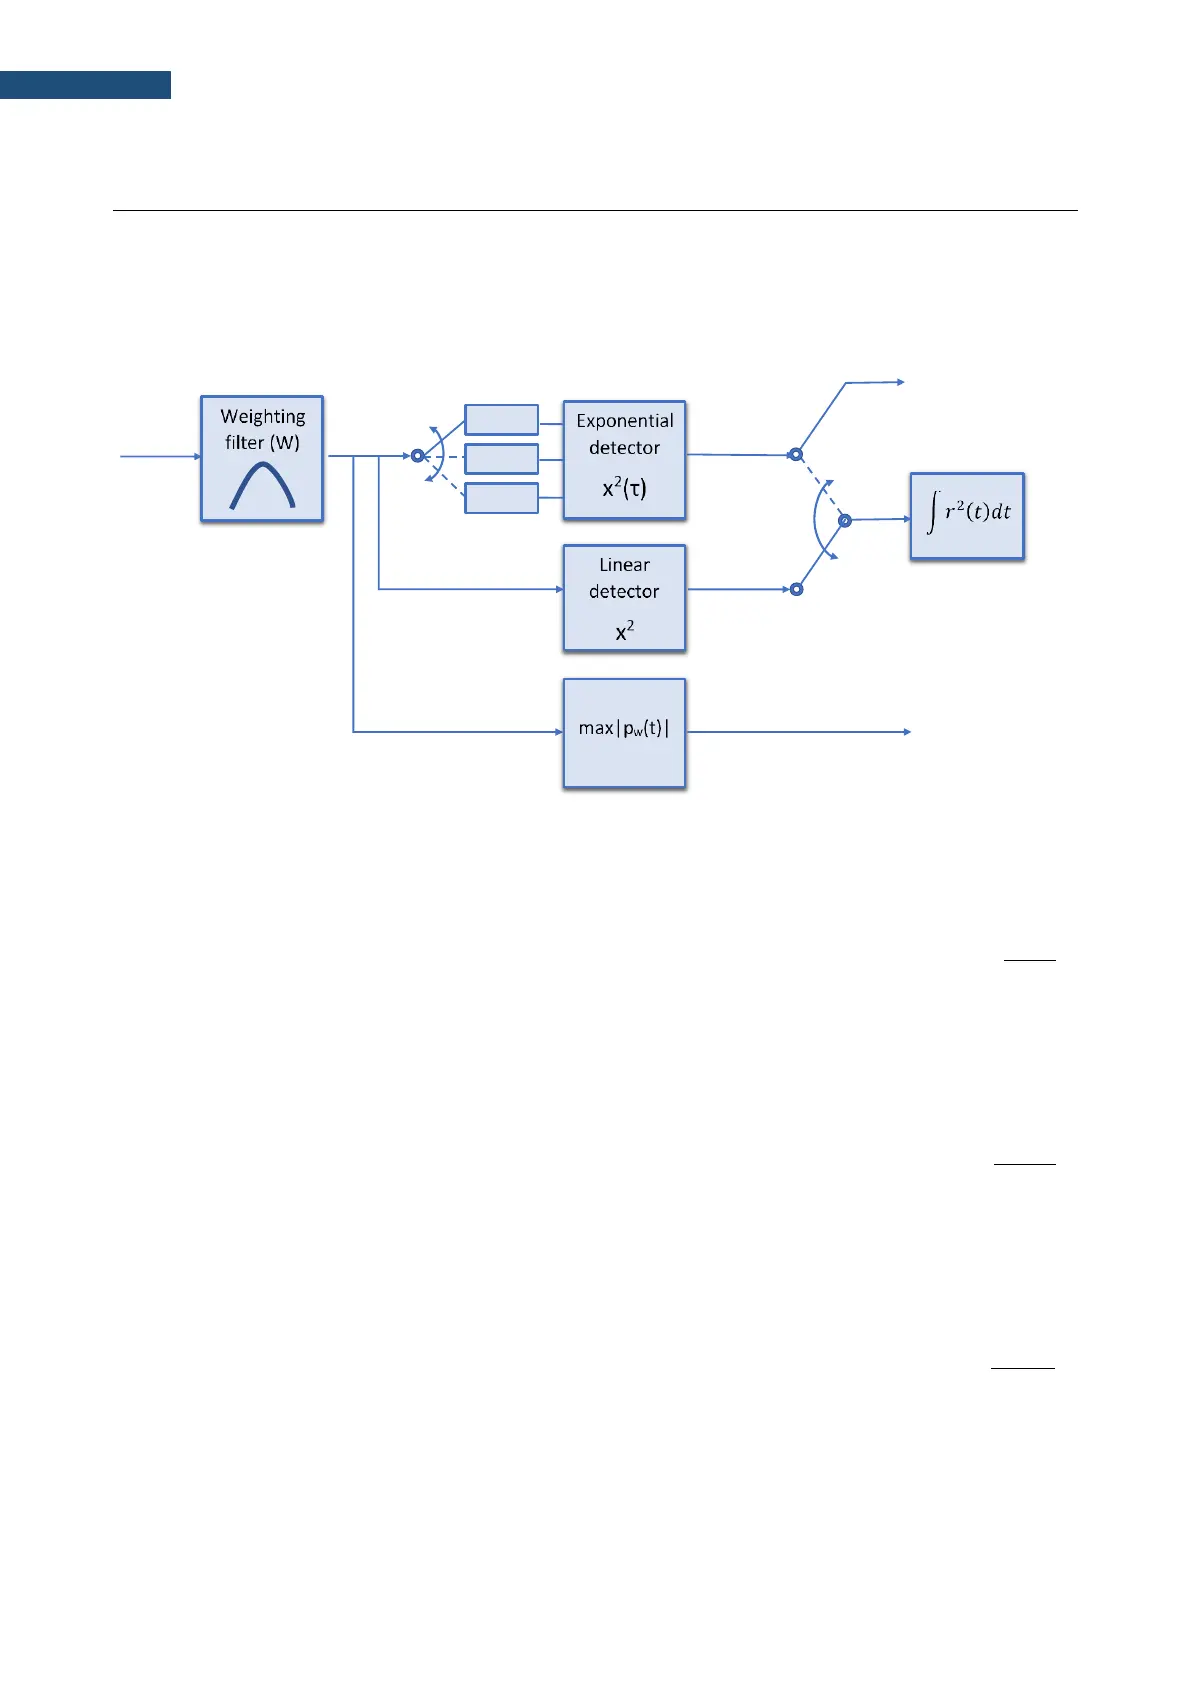
The instrument calculates the sound measurement results for three profiles. The calculation flow diagram for
one profile is presented below:
Percentage of the overloaded input signal, which occurred during the current time
period of the measurement (T)
Peak sound level expressed in dB, for
frequency weightings A, C, Z, symbols are
LApeak, LCpeak and LZpeak. Peak sound
level is calculated for the given T.
( )
=
2
0
2
W
p
tp
maxlog10Peak
T
The highest time weighted sound level (Max)
expressed in dB, within a stated time interval,
for frequency weightings A, C, Z and time
weightings F, S, I symbols are LAFmax,
LASmax, LCFmax, LCSmax etc.
( )
=
2
0
2
W
p
tp
maxlog10Max
T
The lowest time weighted sound level (Min)
expressed in dB, within a stated time interval,
for frequency weightings A, C, Z and time
weightings F, S, I symbols are LAFmin,
LASmin, LCFmin, LCSmin etc.
( )
=
2
0
2
W
p
tp
minlog10Min
T
Lmax, Lmin, Spl,
Ltm3, Ltm5

 Loading...


