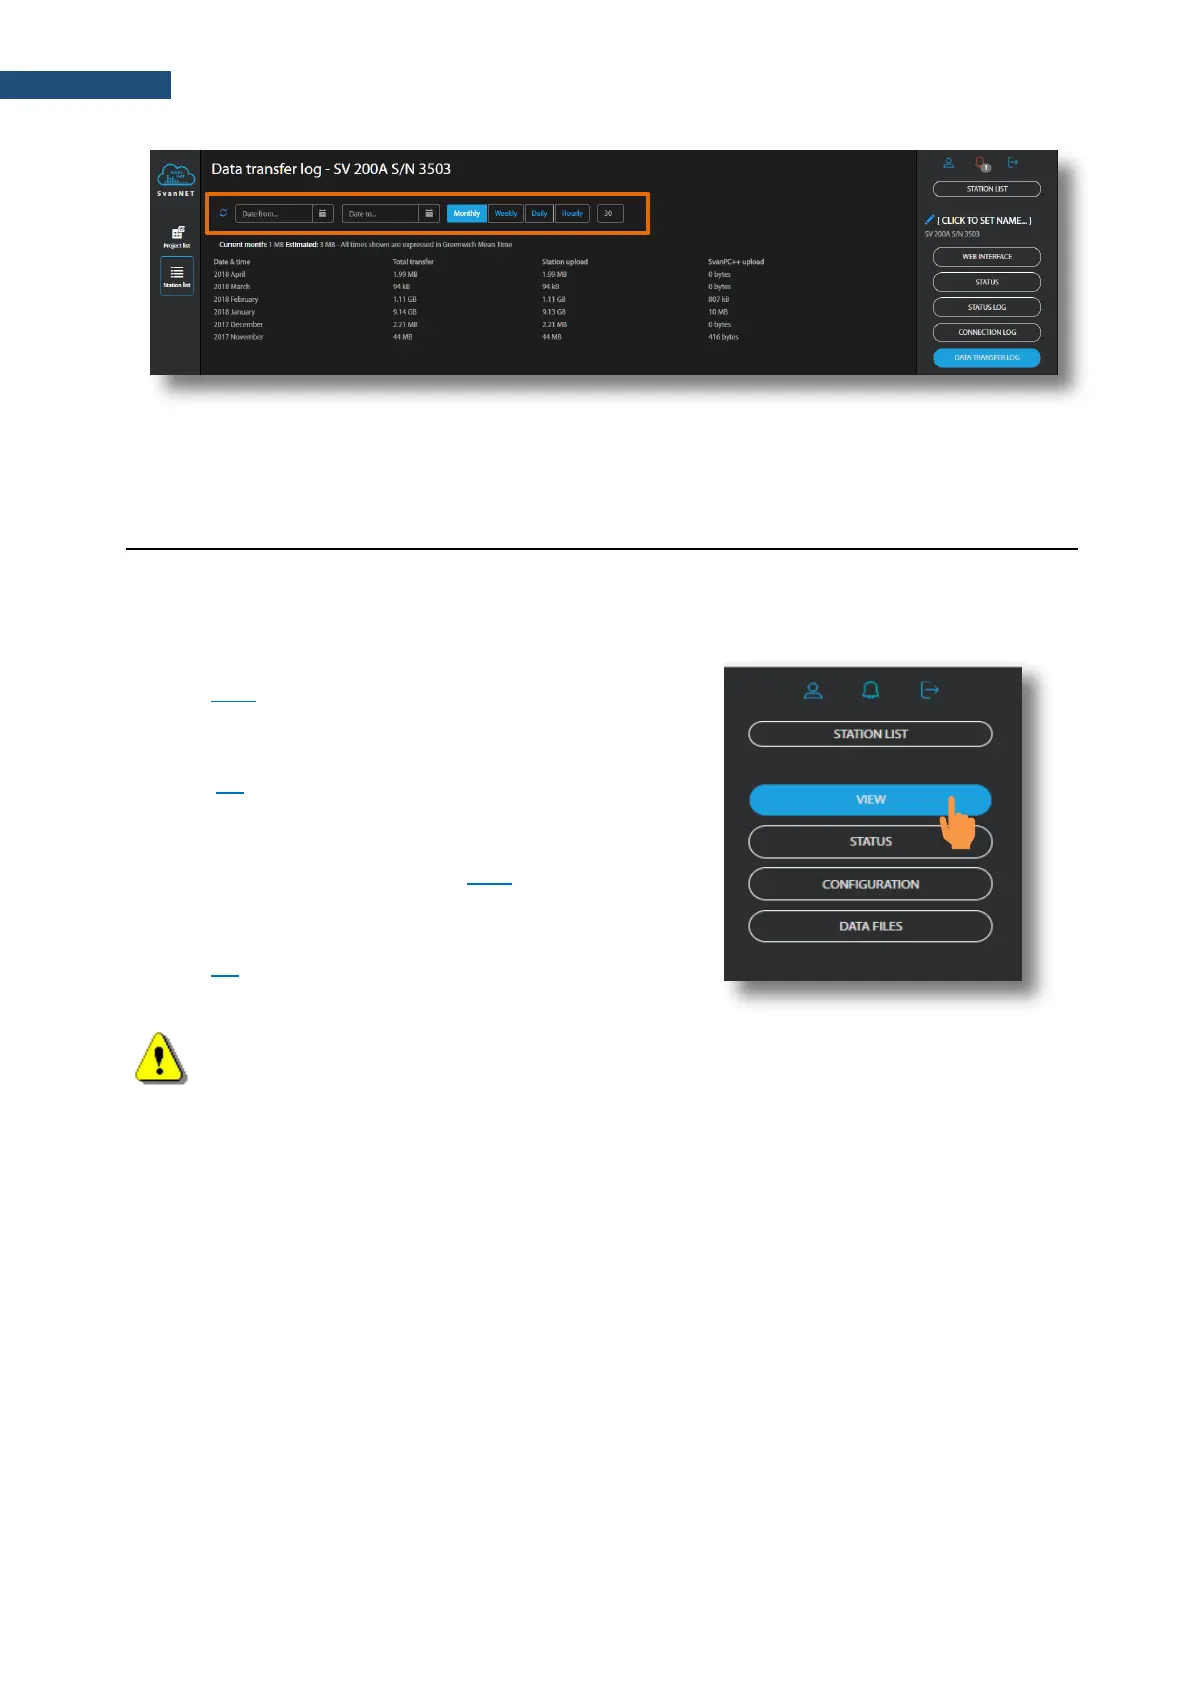
The WEB INTERFACE view is available for the stations connected to SvanNET and enables:
measurement results viewing, station parameters configuring, data files downloading, measurements
start/stop and station checking.
The VIEW button switches you to the Live data view (see
Chapter 8.2.1) in which you can view broadband results, 1/1 or
1/3-octave spectra and time-history results.
The STATUS button switches you to the station status view (see
Chapter 8.3) in which you can check the station status and
start/stop measurements.
The CONFIGURATION button switches you to the station
Configuration view (see Chapter 8.4.1) in which you can
configure measurement and instrument parameters.
The DATA FILES button switches you to the Storage view (see
Chapter 8.4) in which you can download files manually.
Note: Content of the Configuration tabs depends on the selected parameters. The task of
this manual is not the presentation of all possible combinations of parameters, but an indication
of the principles of working with SvanNET.
8.2.1 Live data view
The Live data view includes three tabs: OVERVIEW, TIME HISTORY RESULTS and
SPECTRUM RESULTS.
The OVERVIEW tab displays current broadband results:
1. Instantaneous Results, measured by 1-second period and
2. Summary Results (Current and Previous) measured in the selected profiles by the
“Integration Time” period.
The map field is used to show the instrument’s position and meteorological data.

 Loading...


