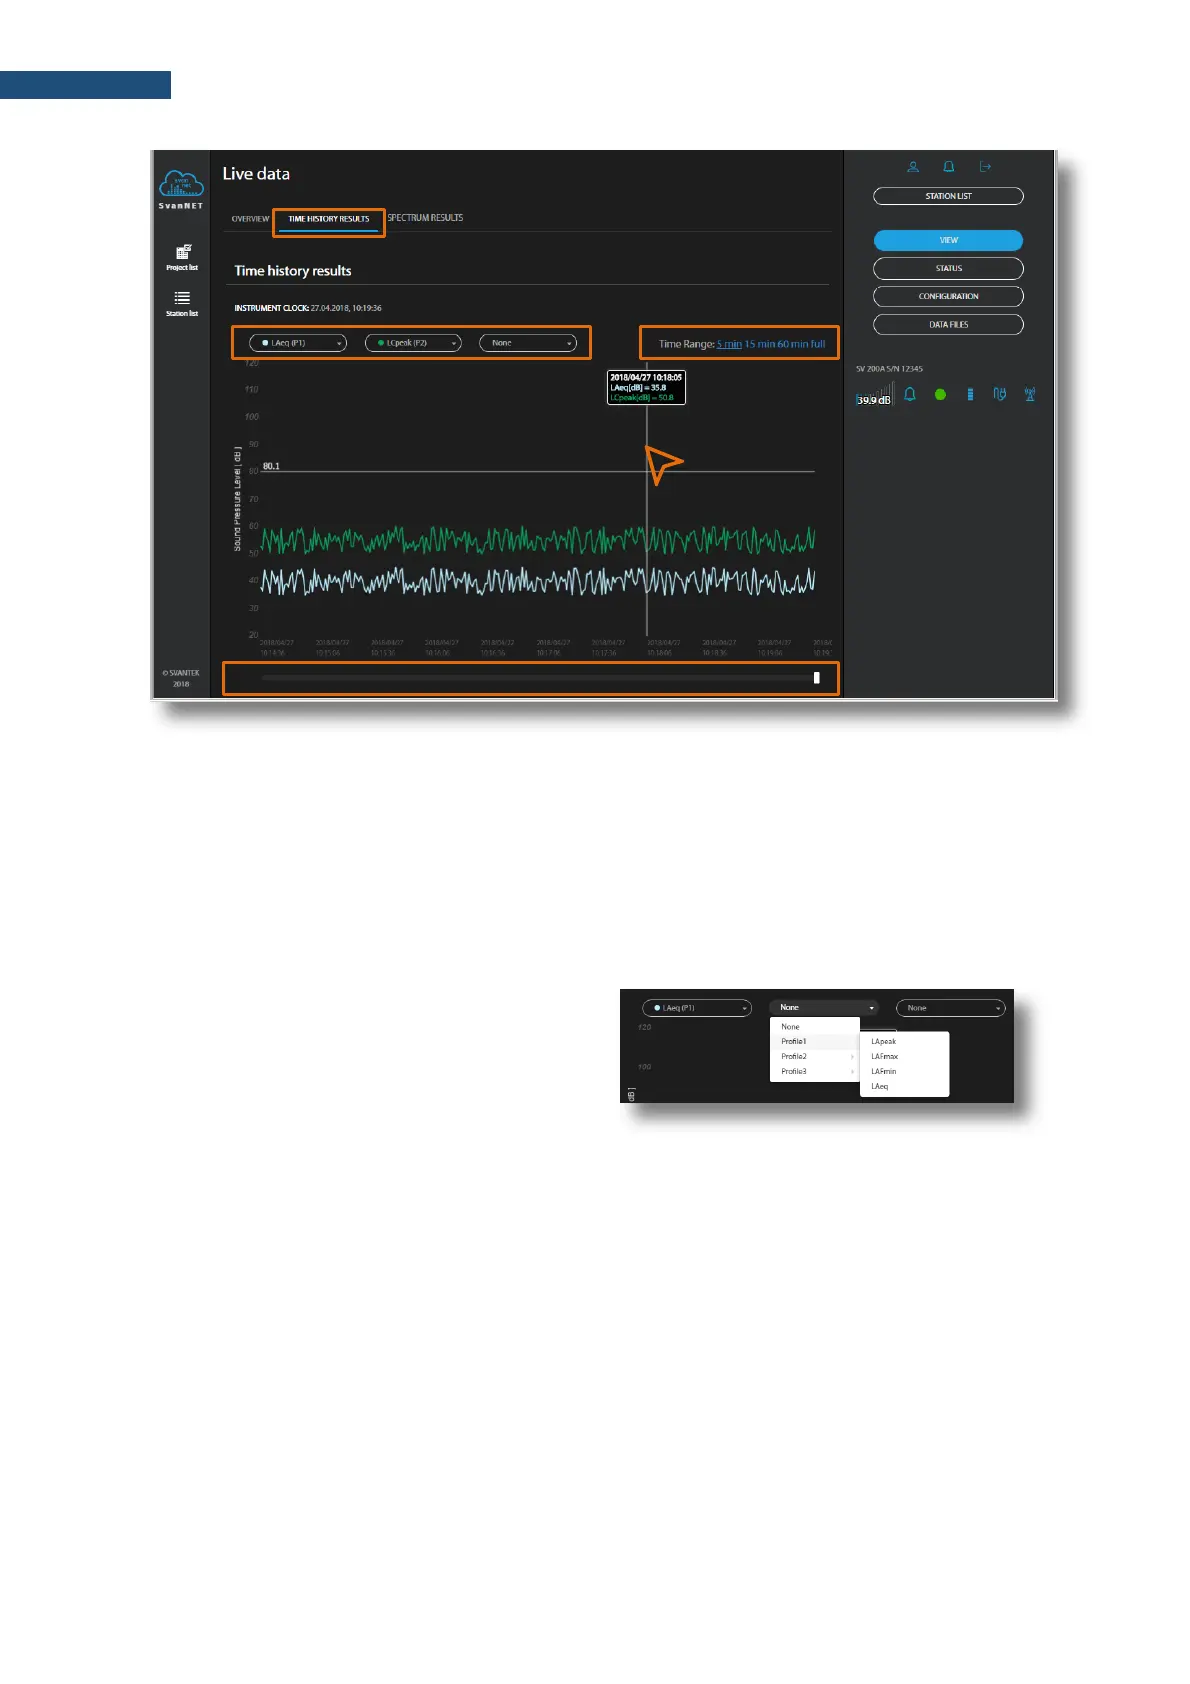
In this tab you can:
1. Choose results for simultaneous displaying with the use of selector buttons (Leq, Lpeak,
Lmax and Lmin) measured in profiles with weighting filters (A, B, C or Z) and detectors (Fast,
Slow or Impulse).
2. Change the time range for presentation of results.
3. Point your mouse cursor on the plot to readout the values for this time point.
4. Scroll the time window over the time history.
There are four results (Leq, Lpeak, Lmax and
Lmin) measured with appropriate weighting filters
and detector types and available for each
measurement profile from the pop-down list.
The SPECTRUM RESULTS tab displays current 1/1 or 1/3-octave Instant and Averaged results (LZeq)
and three Total results. In this tab, you can:
1. Point your mouse cursor on the plot to readout the values of instantaneous and averaged results
for each 1/1 or 1/3-octave band.
2. Point your mouse cursor on the last three bars of the plot to readout the values of instantaneous
and averaged three Total results.

 Loading...


