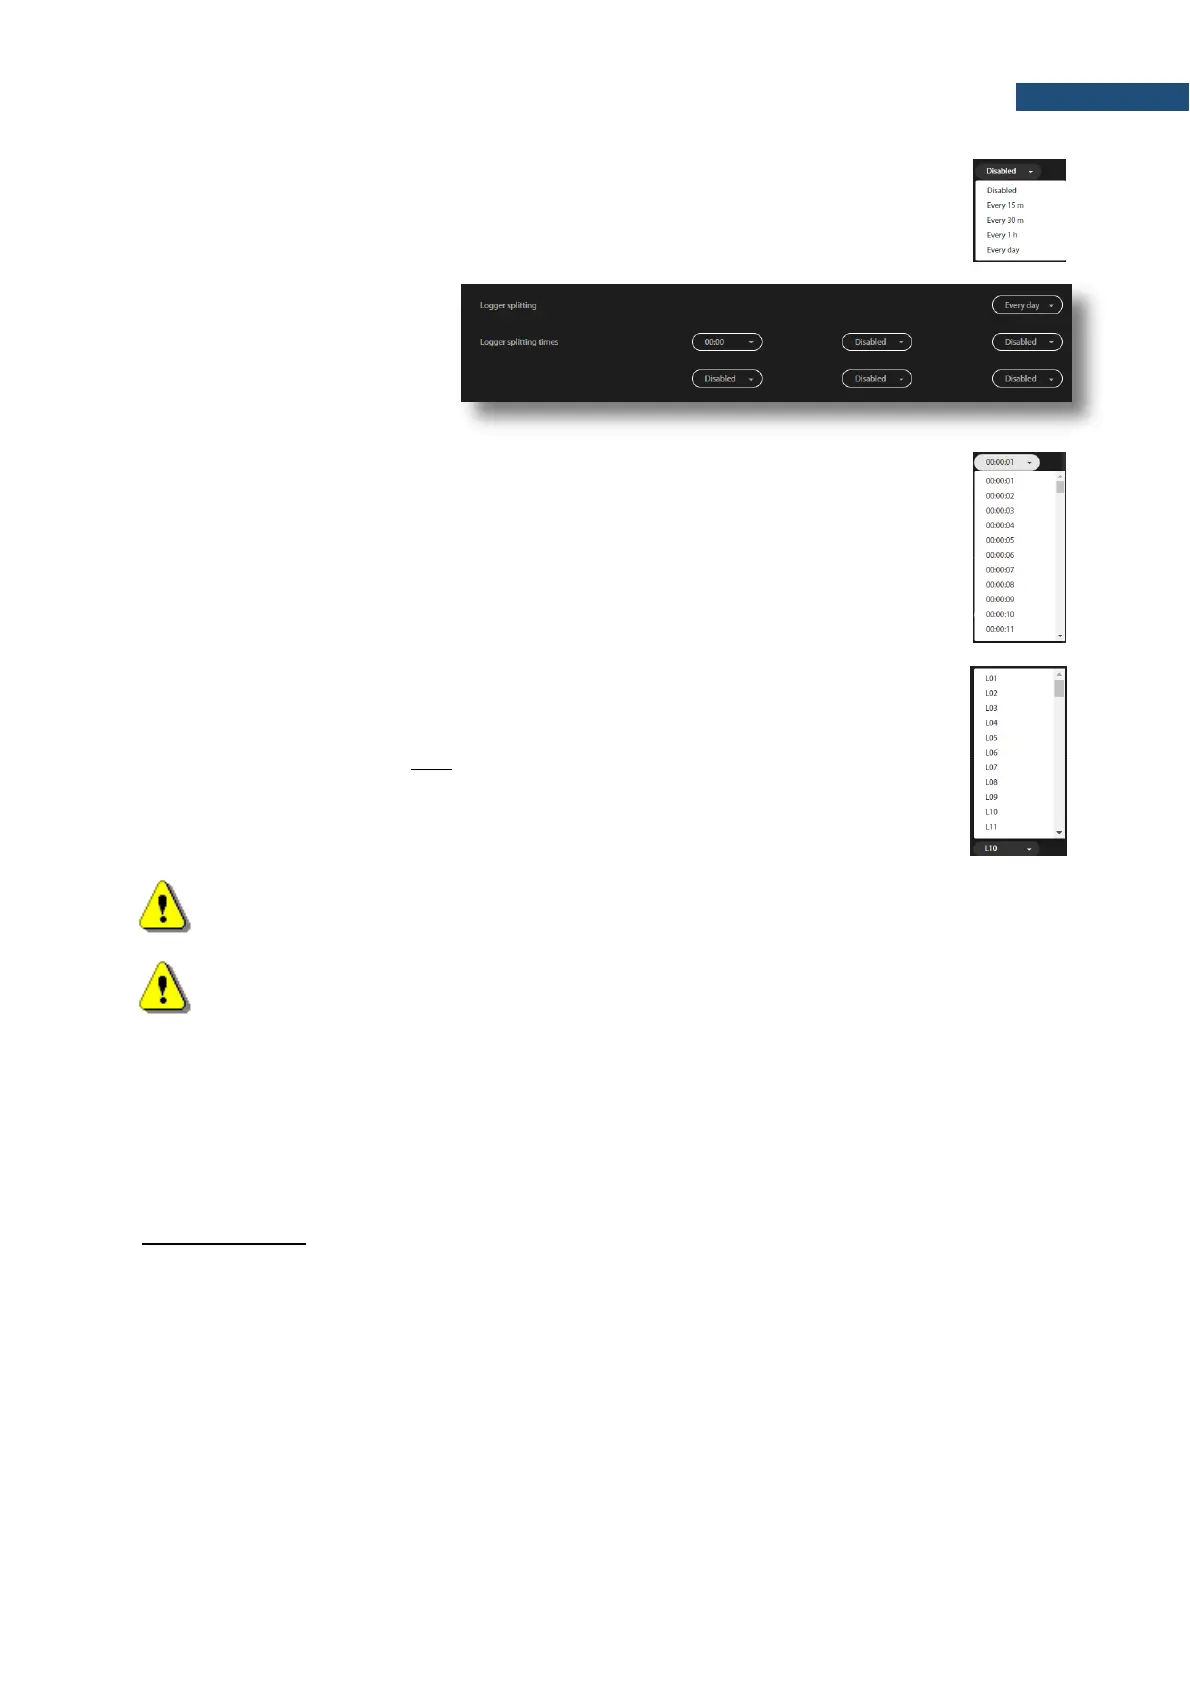
The Logger splitting position enables splitting of the time history files and
selecting the splitting mode: Every 15 m, Every 30 m, Every 1 h and
Every day.
If Every day is selected, you
can then define up to six
points during a day when
splitting will take place.
Integration period defines the period during which the signal is being measured
(averaged) and recorded in the file as the set of Summary Results.
The integration period can be selected in the pop-up list in the range from 1s to 24h.
If you switch on the Save statistics button, you can define ten statistical noise levels,
named from L01 to L99, to be calculated, displayed and saved in the file as Summary
results.
Statistical noise level Lnn is a level in dB which was exceeded during nn percent of
the Integration period. Statistical noise levels are calculated from a histogram,
created on the base of 100ms Leq results (see Appendix D).
Note: To ensure saving of Summary results you should switch on the Time history saving,
since Summary results are saved in the same file with Time history results.
Note: All files with measurement result are automatically named in accordance with the rule:
some prefix (string of letters) is added with a number (string of digits) which is increased by one
for the new created files. Default prefix is “L” and it can be changed via SvanPC++.
If the Octave 1/1 or Octave 1/3 function is selected, you can also switch on spectrum saving
(Save spectrum button) as a time history with the same logger Step.
Step can be selected from the row: 10, 20, 50, 100, 200 and 500 milliseconds, from 1 second to 59
seconds, from 1 minute to 59 minutes and 1 hour.
CSV EXPORT tab
The CSV EXPORT tab enables configuring direct export of measurement data into CSV files (Comma
Separated Values) and saving them on the instrument’s SD card.
In this tab, you can:
1. Select results to be exported for each profile individually.
2. Select Maximum, Minimum and Averaged spectra for each integration period if the Octave 1/1
or Octave 1/3 function is enabled.

 Loading...


