Creating and Using Math Waveforms
CSA7000B Series & TDS7000B Series Instruments User Manual
3- 205
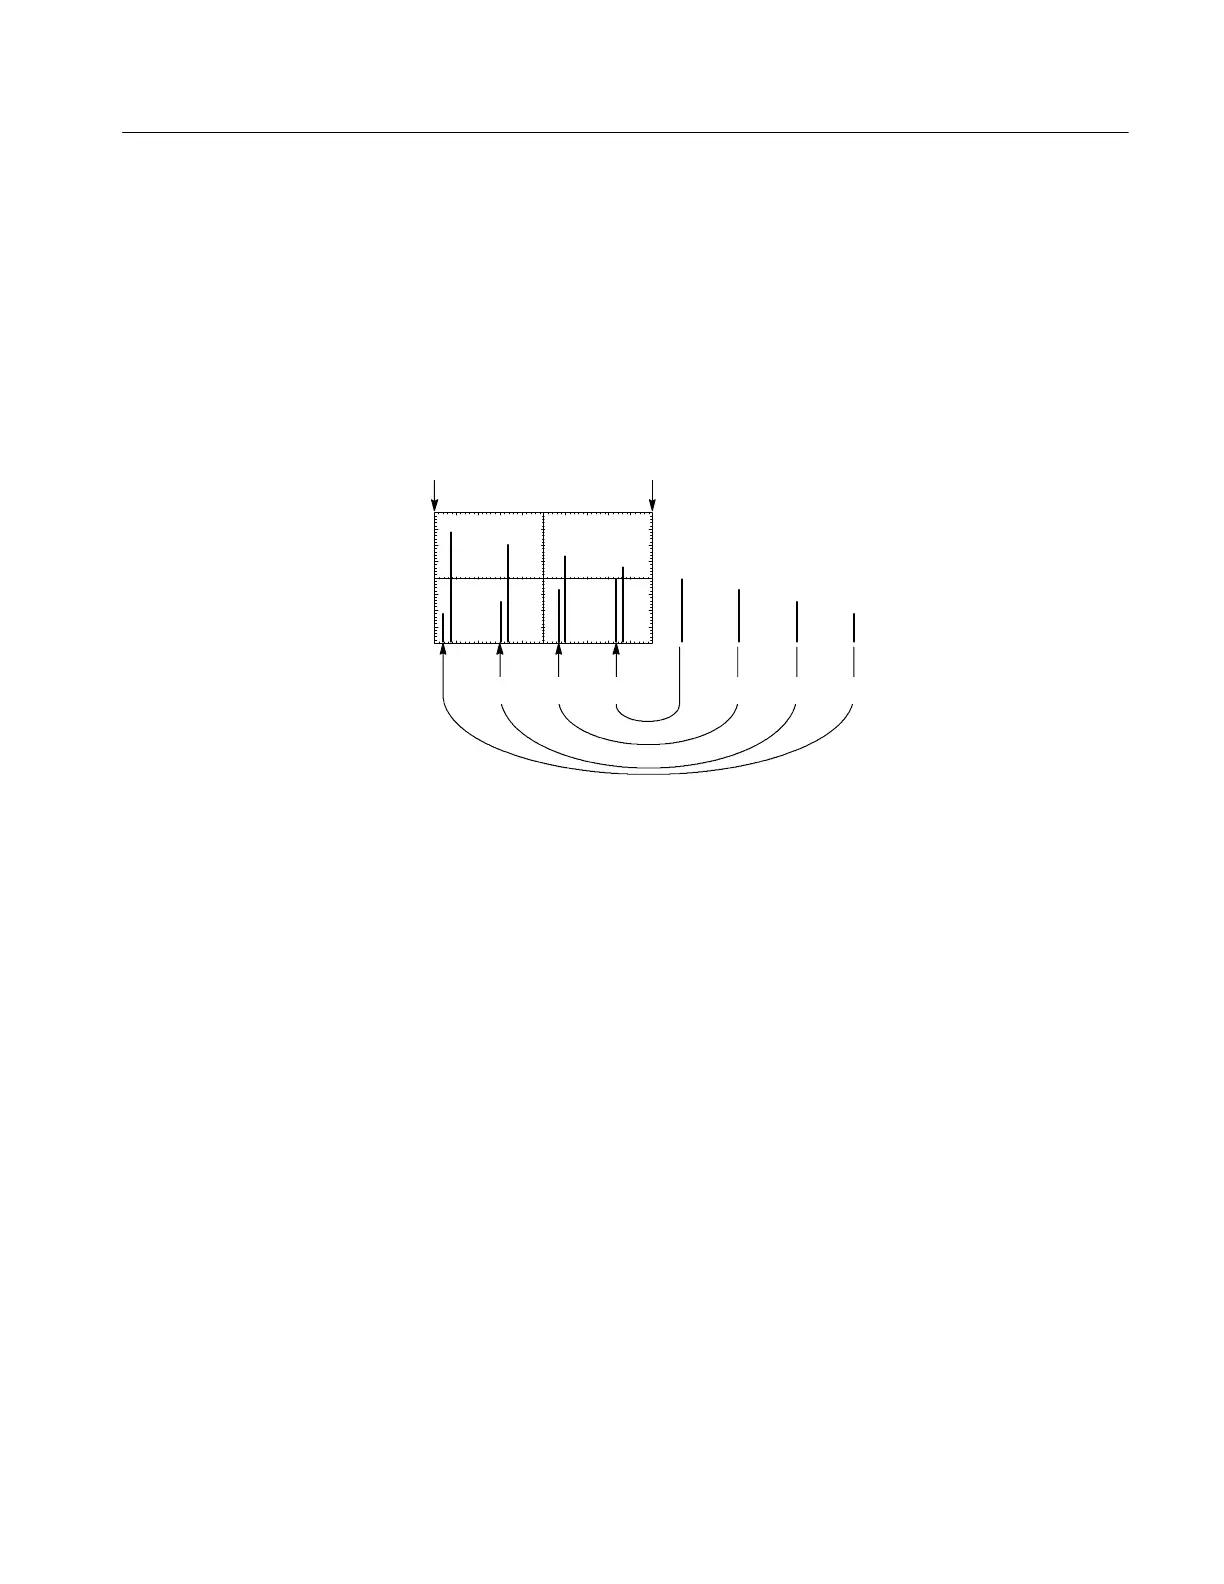
Higher order harmonics usually have decreasing magnitudes compared to lower
order harmonics. Thus, if you see a series of increasing harmonic magnitude
values as frequency increases, then you can suspect that they may be aliased. In
the spectral math waveform, the actual higher frequency components are
undersampled, and therefore, they appear as lower frequency aliases that “fold
back” around the Nyquist point. (See Figure 3--63.) You can test by increasing
the sample rate and observing if aliases unwrap to different frequency positions.
Frequency
Amplitude
Aliased frequencies
0Hz
Nyquist frequency
(½ sample rate)
Actual frequencies
Figure 3- 63: How aliased frequencies appear in a spectral waveform
Another way to observe aliasing, if you have a variable frequency signal source,
is to adjust the frequency slowly while watching the spectral display. If some of
the harmonics are aliased, you will see the harmonics decreasing in frequency
when they should be increasing or vice versa. Using averaging in either the time
or frequency domain will make these frequency shifts more sluggish.
To Take Cursor Measurements of a Spectral Math Waveform. Once you have
displayed a spectral math waveform, use cursors to measure the frequency
amplitude or phase angle. See Taking C ursor Measurements on page 3--151.
To Take Automated Measurements of a Spectral Math Waveform. You can use
automated measurements to measure spectral math waveforms. Use the
procedure To Take Automated Measurements on page 3--144.