Measuring Waveforms
CSA7000B Series & TDS7000B Series Instruments User Manual
3- 143
High (Histogram)
Low (Histogram)
Low (Min/Max)
High (Min/Max)
High (Mean)
Low (Mean)
Mid reference
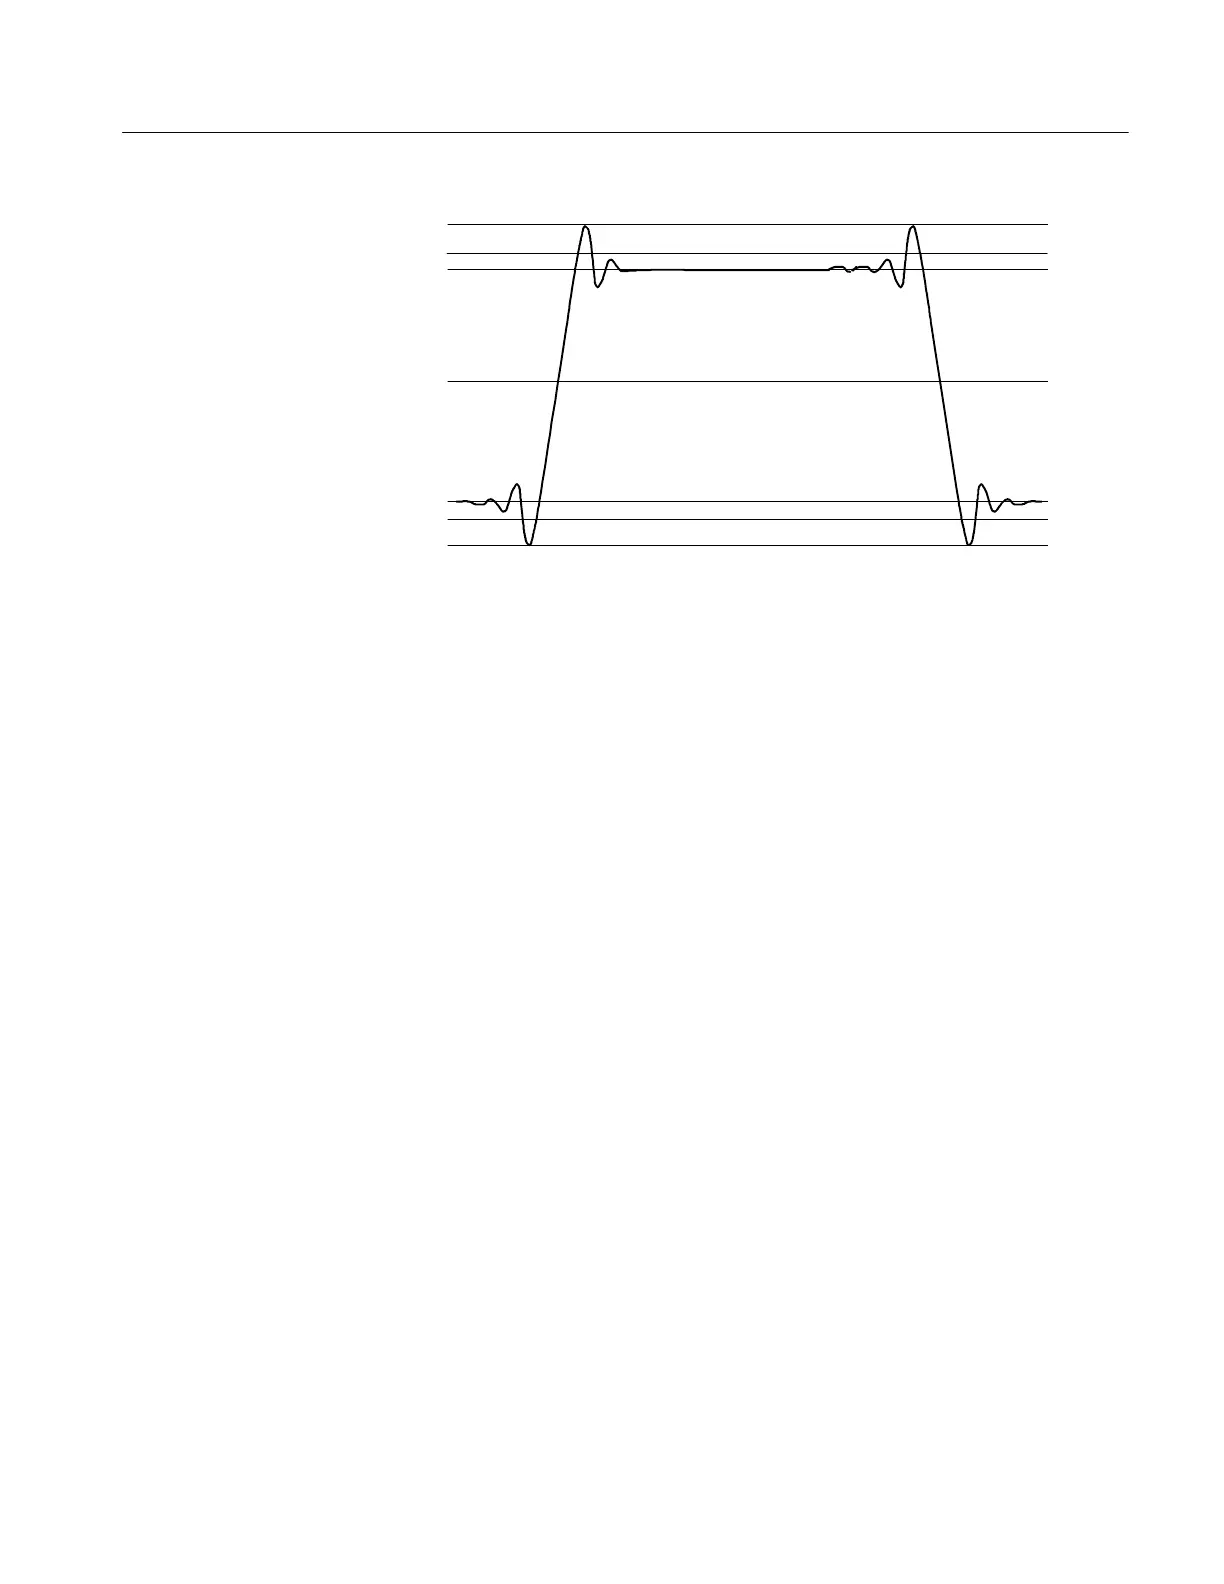
Figure 3- 36: High/Low tracking methods
H Min-max. Uses the highest and lowest values of the waveform rec or d. This
setting is best for examining wavefor ms that have no lar ge , fla t portions at a
common value, such as sine waves and triangle waves — almost any waveform
except for pulses. See Figure 3--36.
H Histogram mean. Sets the values statistically. Using a histogram, it selects
the mean or average value derived using all values either above or below the
midpoint (depending on whether it is defining the high or low reference
level). This setting is best for examining eye patter ns and optical signals. See
Figure 3--36.
H Noise. (Optional on TDS7000B Series) Tells the instrument if the noise
measurement is at the top or the bottom of the eye diagram.
H Signal Type. (Optional on TDS7000B Series) Lets the instrument know if
the signal to be measured is a pulse waveform or an eye diagram.
Reference Levels Method. A second set of levels affect the fidelity of time-related
measurements, the Hi, Mid, and Lo references. For example, the measurement
system takes risetime measurements from the waveform-edge that transitions
from the Low to High reference levels.
You can set the calculation method for each measurement. The instrument
provides the following calculation methods; refer to Figure 3--37 as you read
about each method:
H Relative Reference Calculated as a percentage of the High/Low range.
H Absolute Reference Set by absolute values in user units.