Creating and Using Math Waveforms
CSA7000B Series & TDS7000B Series Instruments User Manual
3- 201
1
0
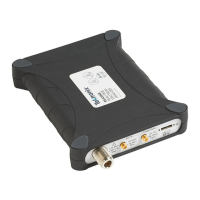
Amplitude
Time
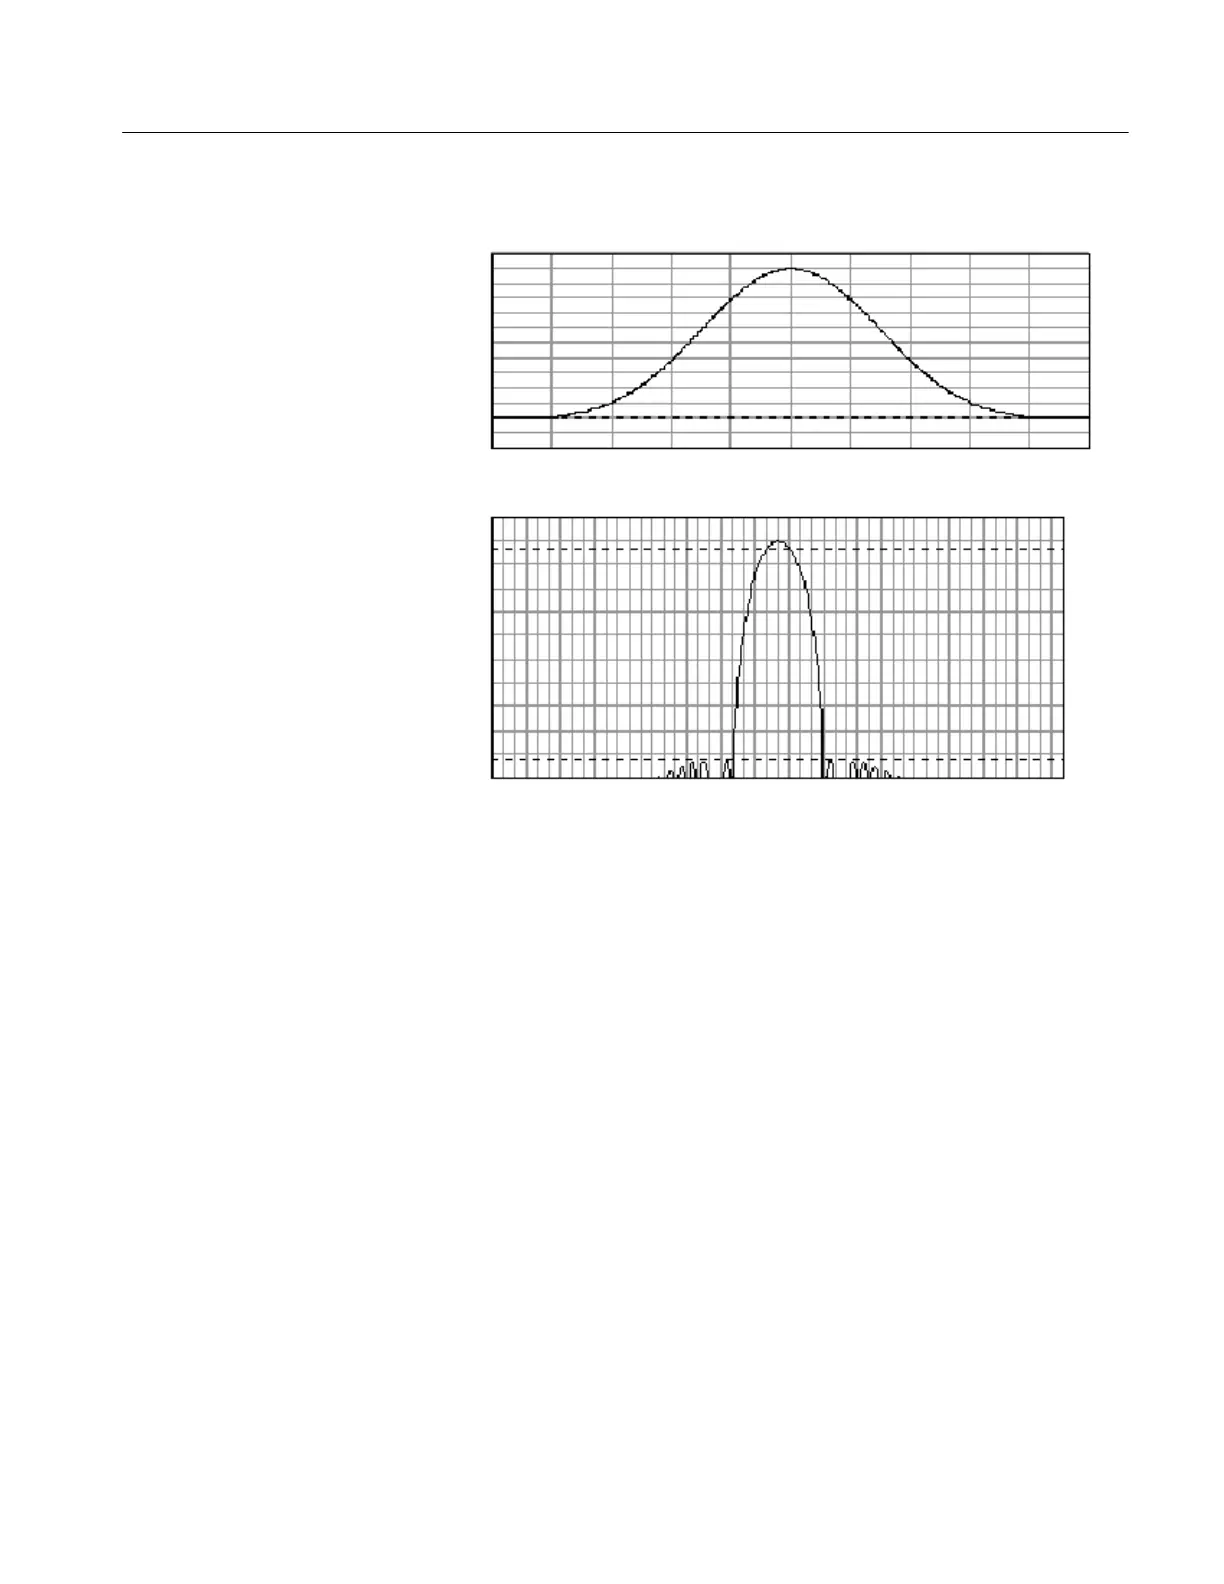
--92 dB side lobe
0
-- 8 0
dB
Frequency bins
-- 4 0
Figure 3- 60: Time and frequency graphs of the Blackman-Harris window
H Flattop2 Window. This window has the lowest scallop loss of any of the
windows (see Figure 3--61). It also has a wider resolution bandwidth but
lower side lobe attenuation. Also, it is unique because the time domain shape
has negative values.