Measuring Waveforms
CSA7000B Series & TDS7000B Series Instruments User Manual
3- 157
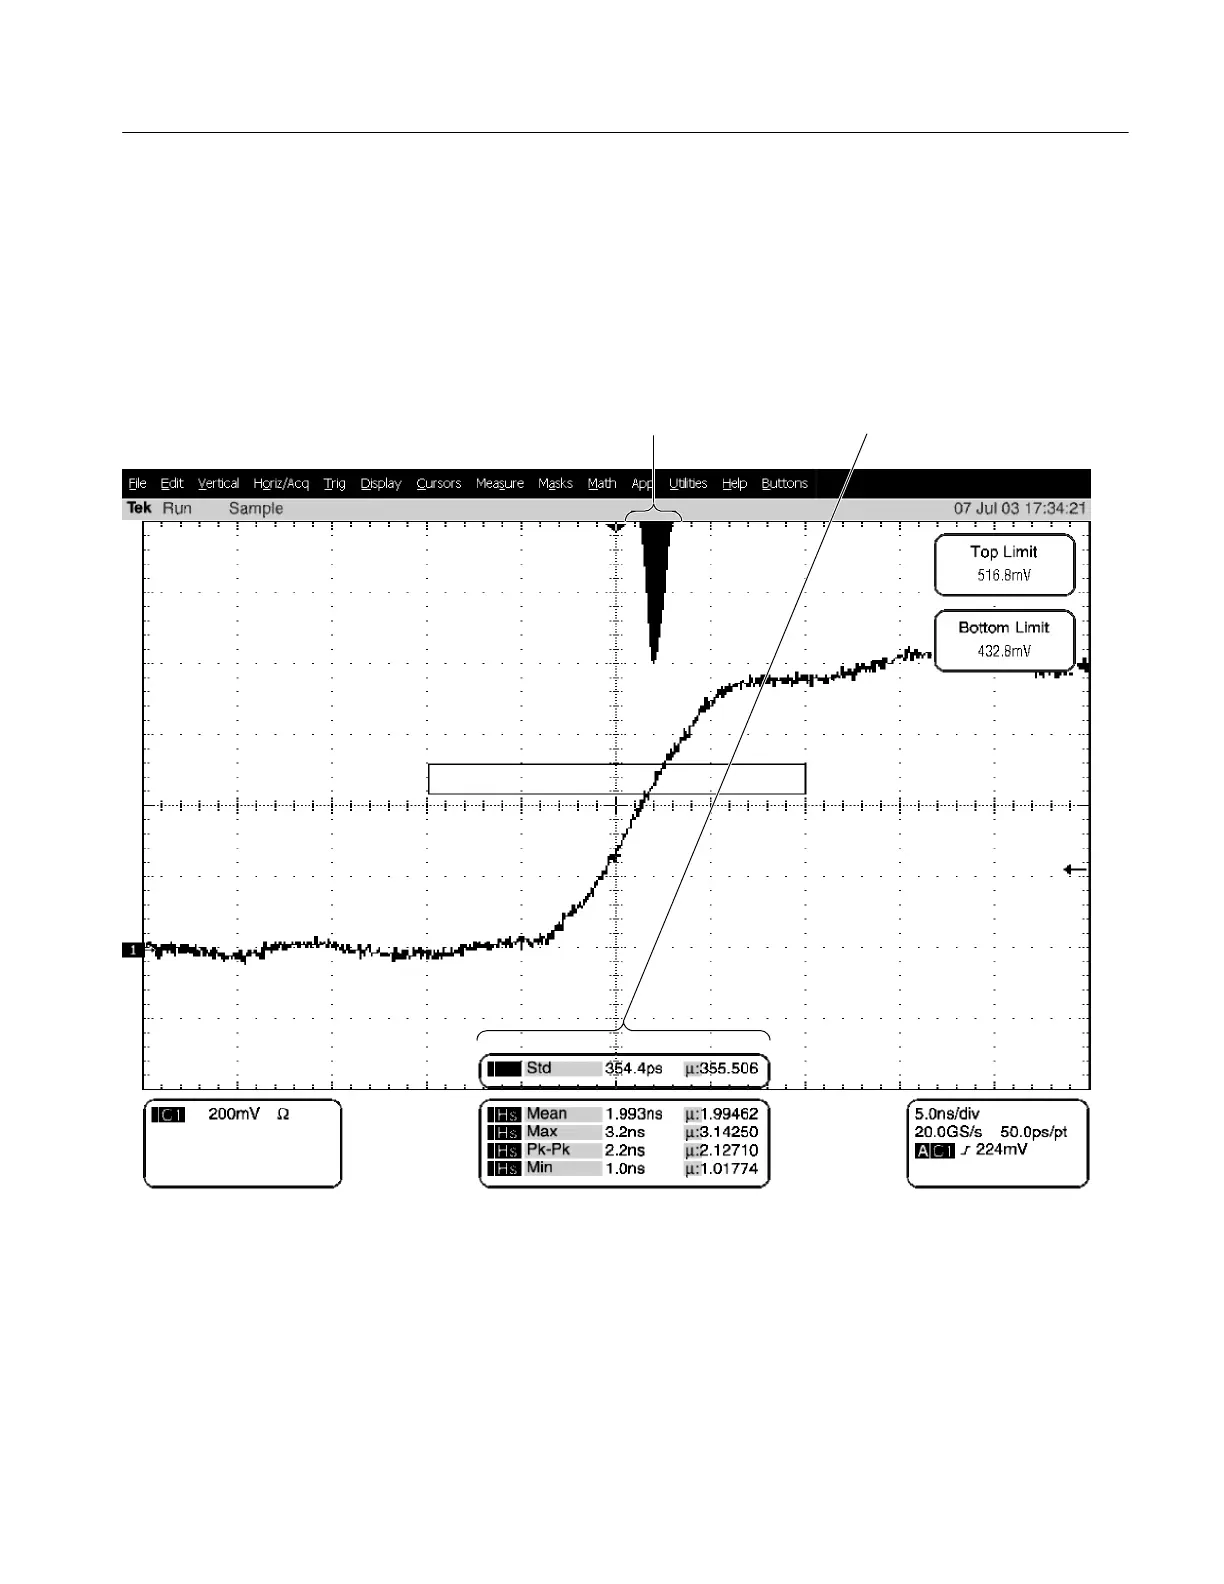
Taking Histograms
The instrument can display histograms constructed from the selected waveform
data. You can display both vertical (voltage) and horizontal (time) histograms,
but only one at a time. Use histogram measurements to get statistical measure-
ment data for a section of a waveform along one axis.
Horizontal histogram
Histogram measurements
Figure 3- 40: Horizontal histogram view and measurement data