11–14 Lists
826886~1.DOC TI-83 international English Bob Fedorisko Revised: 10/26/05 1:33 PM Printed: 10/27/05 2:50
PM Page 14 of 18
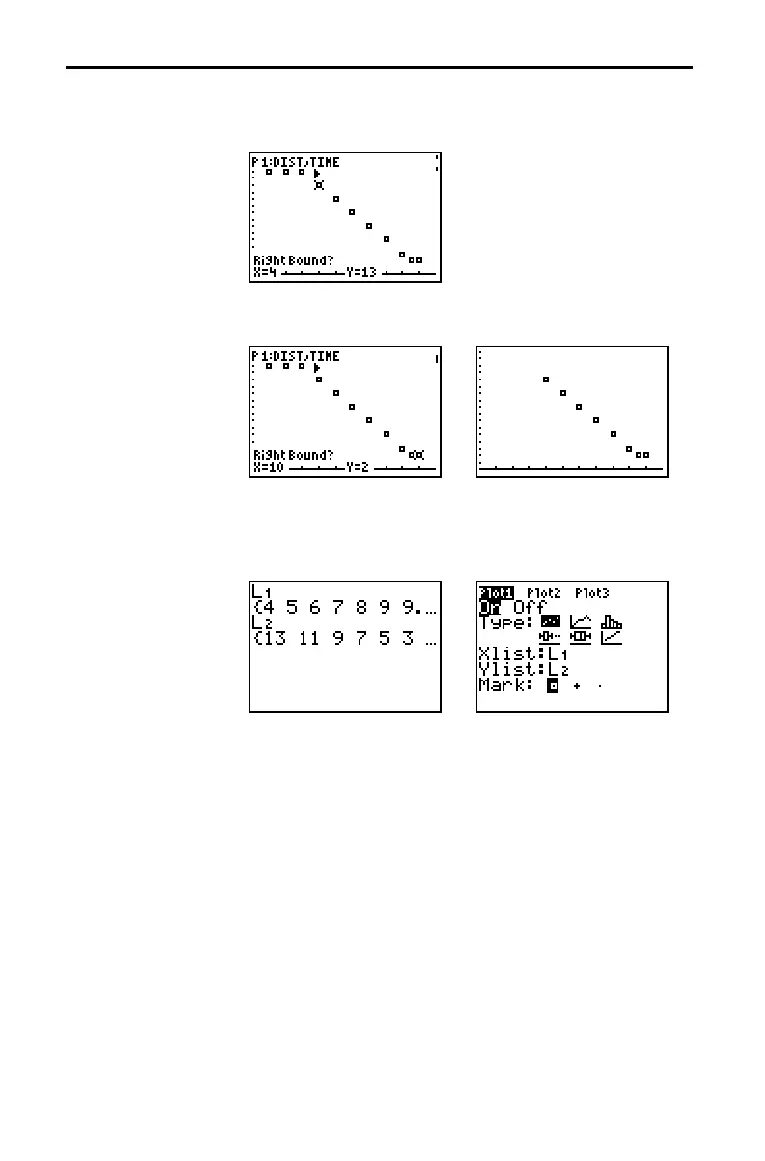
6. Press Í. A 4 indicator on the graph screen shows the left
bound.
Right Bound? is displayed in the bottom-left corner.
7. Press | or ~ to move the cursor to the stat plot point that you
want for the right bound, and then press Í.
The x-values and y-values of the selected points are stored in
xlistname and ylistname. A new stat plot of xlistname and
ylistname replaces the stat plot from which you selected data
points. The list names are updated in the stat plot editor.
Note: The two new lists (xlistname and ylistname) will include the
points you select as left bound and right bound. Also, left-bound
x-value right-bound x-value must be true.
LIST OPS Menu (continued)
Using Select( to
Select Data
Points from a
Plot (continued)

 Loading...


