12–4 Statistics
82D315~1.DOC TI-83 international English Bob Fedorisko Revised: 10/26/05 1:36 PM Printed: 10/27/05 2:53
PM Page 4 of 38
Since the scatter plot of time-versus-length data appears to be approximately linear,
fit a line to the data.
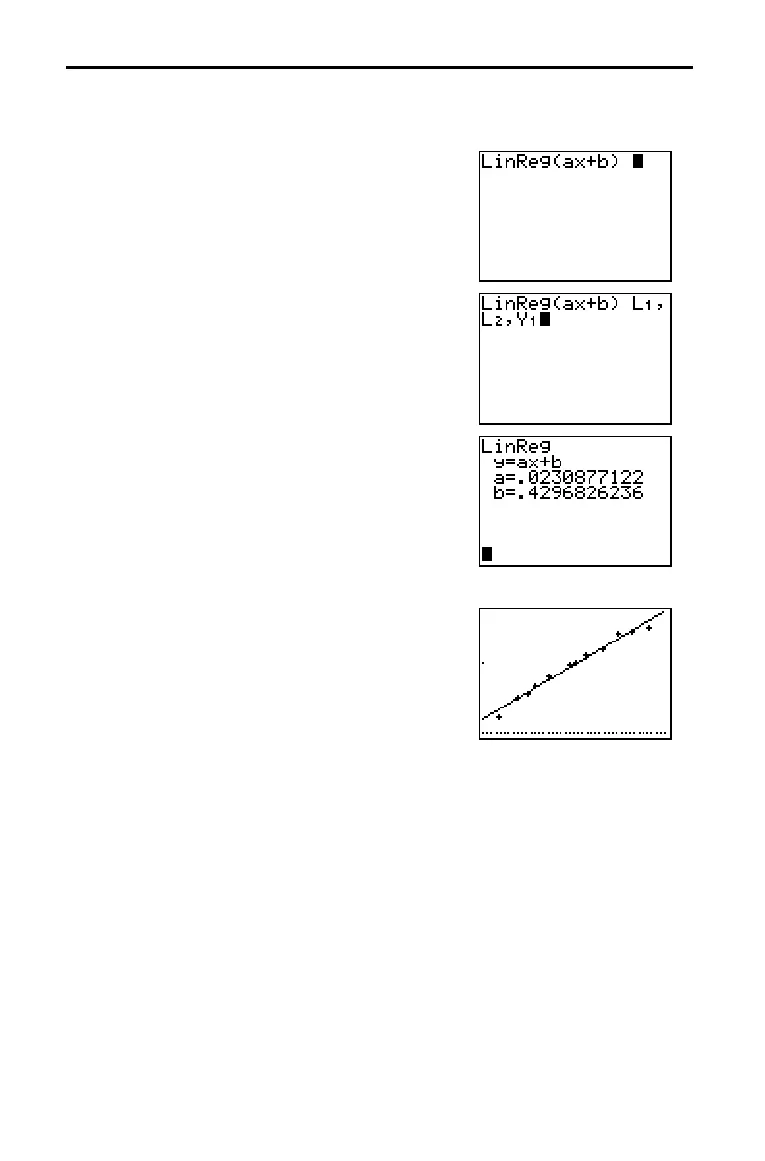
10. Press … ~
4 to select 4:LinReg(ax+b)
(linear regression model) from the STAT
CALC
menu. LinReg(ax+b) is pasted to the
home screen.
11. Press y [L1] ¢ y [L2] ¢. Press
~
1 to display the VARS Y.VARS
FUNCTION
secondary menu, and then press
1 to select 1:Y1. L1, L2, and Y1 are pasted to
the home screen as arguments to
LinReg(ax+b).
12. Press Í to execute LinReg(ax+b). The
linear regression for the data in
L1 and L2 is
calculated. Values for
a and b are displayed on
the home screen. The linear regression
equation is stored in
Y1. Residuals are
calculated and stored automatically in the list
name
RESID, which becomes an item on the
LIST NAMES menu.
13. Press s. The regression line and the
scatter plot are displayed.
Getting Started: Pendulum Lengths and Periods (cont.)

 Loading...


