Statistics 12–5
82D315~1.DOC TI-83 international English Bob Fedorisko Revised: 10/26/05 1:36 PM Printed: 10/27/05 2:53
PM Page 5 of 38
The regression line appears to fit the central portion of the scatter plot well. However,
a residual plot may provide more information about this fit.
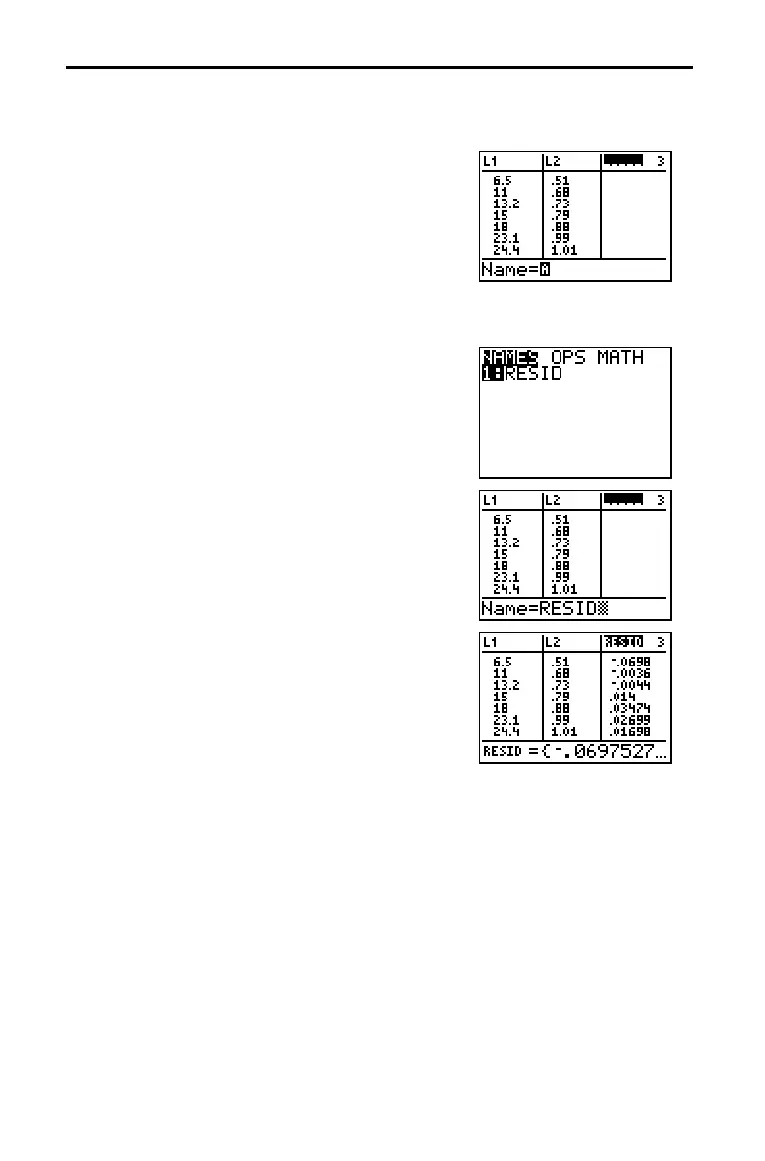
14. Press …
1 to select 1:Edit. The stat list
editor is displayed.
Press ~ and } to move the cursor onto
L3.
Press y [INS]. An unnamed column is
displayed in column
3; L3, L4, L5, and L6
shift right one column. The Name= promp
is displayed in the entry line, and alpha-lock
is on.
15. Press y [LIST] to display the LIST NAMES
menu.
If necessary, press † to move the cursor
onto the list name
RESID.
16. Press Í to select RESID and paste it to
the stat list editor’s
Name= prompt.
17. Press Í. RESID is stored in column 3 of
the stat list editor.
Press † repeatedly to examine the
residuals.
Notice that the first three residuals are negative. They correspond to the shortest
pendulum string lengths in
L1. The next five residuals are positive, and three of the
last four are negative. The latter correspond to the longer string lengths in
L1. Plotting
the residuals will show this pattern more clearly.

 Loading...


