12–6 Statistics
82D315~1.DOC TI-83 international English Bob Fedorisko Revised: 10/26/05 1:36 PM Printed: 10/27/05 2:53
PM Page 6 of 38
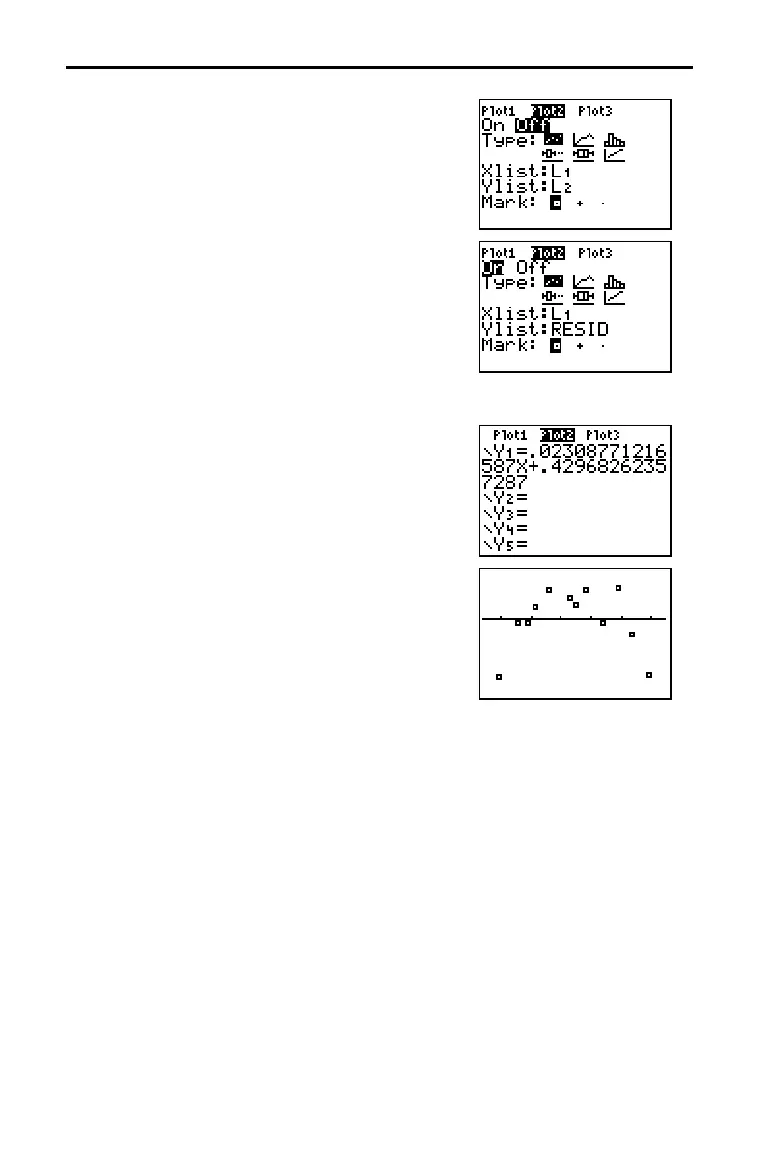
18. Press y [STAT PLOT] 2 to select 2:Plot2
from the STAT PLOTS menu. The stat plot
editor is displayed for plot 2.
19. Press Í to select On, which turns on
plot 2.
Press † Í to select
"
"
(scatter plot).
Press † y [
L1] to specify Xlist:L1 for plot
2. Press † [
R] [E] [S] [I] [D] (alpha-lock is
on) to specify
Ylist:RESID for plot 2. Press
† Í to select
› as the mark for each
data point on the scatter plot.
20. Press o to display the Y= editor.
Press | to move the cursor onto the = sign,
and then press Í to deselect
Y1. Press
} Í to turn off plot 1.
21. Press q 9 to select 9:ZoomStat from the
ZOOM menu. The window variables are
adjusted automatically, and plot 2 is
displayed. This is a scatter plot of the
residuals.
Notice the pattern of the residuals: a group of negative residuals, then a group of
positive residuals, and then another group of negative residuals.
Getting Started: Pendulum Lengths and Periods (cont.)

 Loading...


