3D Graphing 382
Note: You can move the cursor only within the x and y boundaries set by Window
variables
xmin, xmax, ymin, and ymax.
Although the rules are straightforward, the actual cursor movement can be confusing
unless you know the orientation of the axes.
Note: To show the axes and their labels from the Y= Editor, Window Editor, or Graph
screen, use:
8
F
Simple Example of Moving the Cursor
Simple Example of Moving the CursorSimple Example of Moving the Cursor
Simple Example of Moving the Cursor
The following graph shows a sloped plane that has the equation z1(x,y) = ‘M(x + y) / 2.
Suppose you want to trace around the displayed boundary.
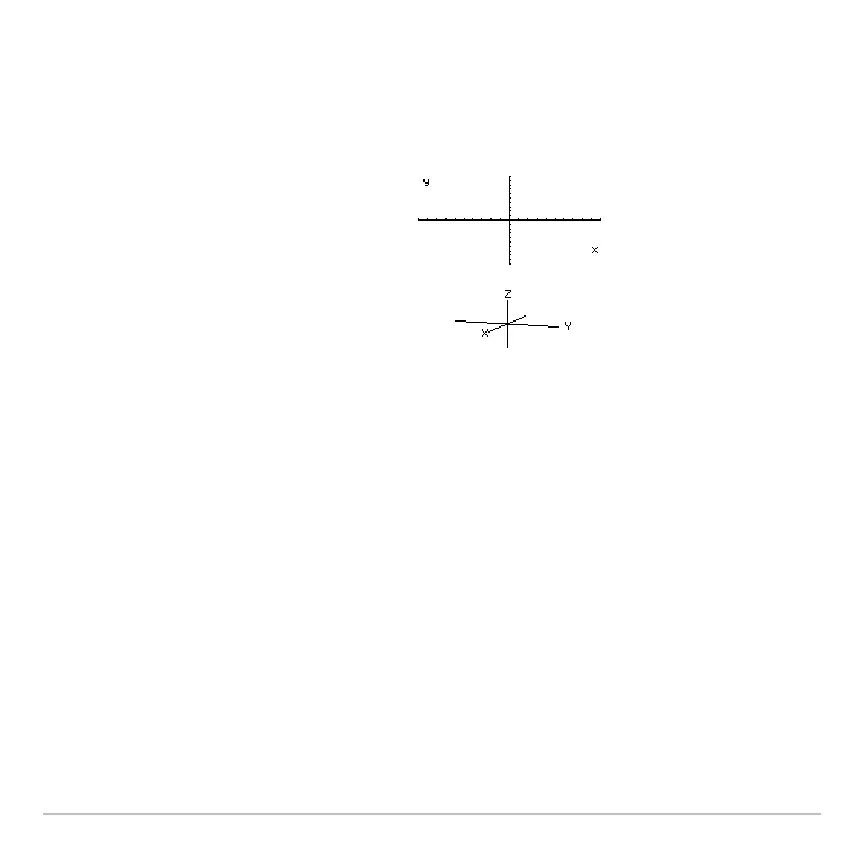
In 2D graphing, the x and y axes always
have the same orientation relative to the
Graph screen.
In 3D graphing, x and y have a different
orientation relative to the Graph screen.
Also, you can rotate and/or elevate the
viewing angle.
eyeq=20 eyef=70 eyeψ=0

 Loading...


