Previews 85
Basic Function Graphing I
Basic Function Graphing I Basic Function Graphing I
Basic Function Graphing I
The example in this section demonstrates some of the graphing capabilities of the
Voyage™ 200 keystrokes. It illustrates how to graph a function using the
Y= Editor. You
will learn how to enter a function, produce a graph of the function, trace a curve, find a
minimum point, and transfer the minimum coordinates to the Home screen.
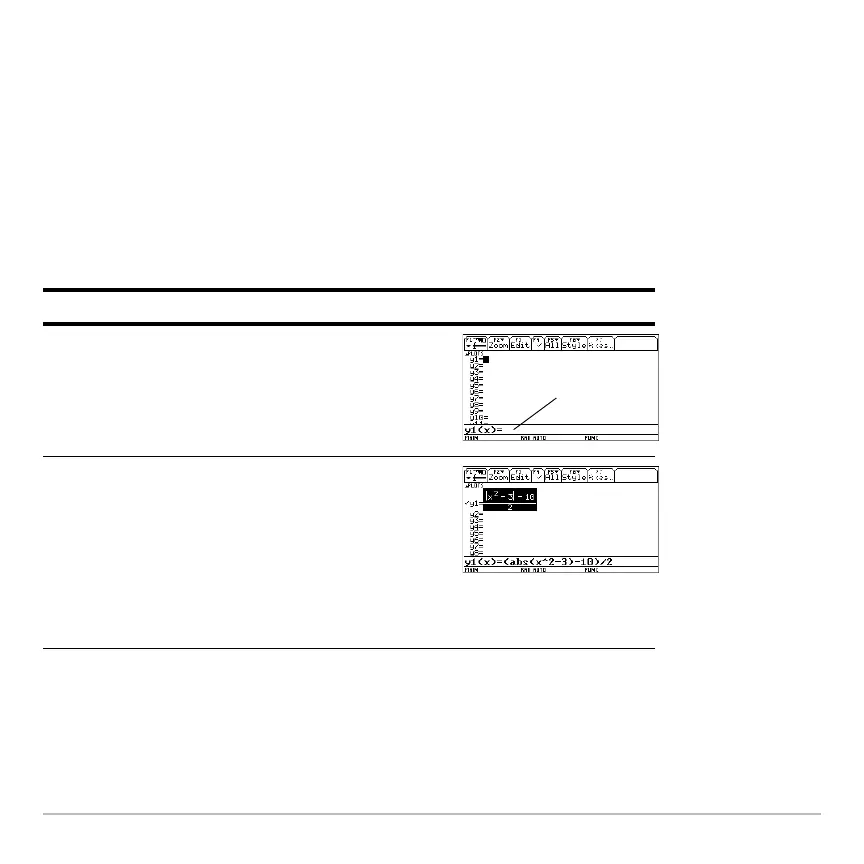
Explore the graphing capabilities of the Voyage™ 200 by graphing the function
y=(|x
2
N3|N10)/2.
Steps and keystrokes Display
1. Display the Y= Editor.
Press 8 #
2. Enter the function
(abs(x
2
N3)N10)/2.
The screen shot shows the “pretty print”
display at y1=.
Press c 2 E A ¸ X Z 2 | 3
d | 1 0 d e 2 ¸
entry line

 Loading...


