EasyManuals Logo

Texas Instruments Voyage 200 User Manual

Texas Instruments Voyage 200
1008 pages
To Next Page IconTo Next Page
To Previous Page IconTo Previous Page
Page #94 background imageLoading...
Page #94 background image
Previews 94
Polar Graphing
Polar Graphing Polar Graphing
Polar Graphing
The graph of the polar equation r1(q) = A sin Bq forms the shape of a rose. Graph the
rose for A=8 and B=2.5. Then explore the appearance of the rose for other values of A
and B.
Steps and keystrokes Display
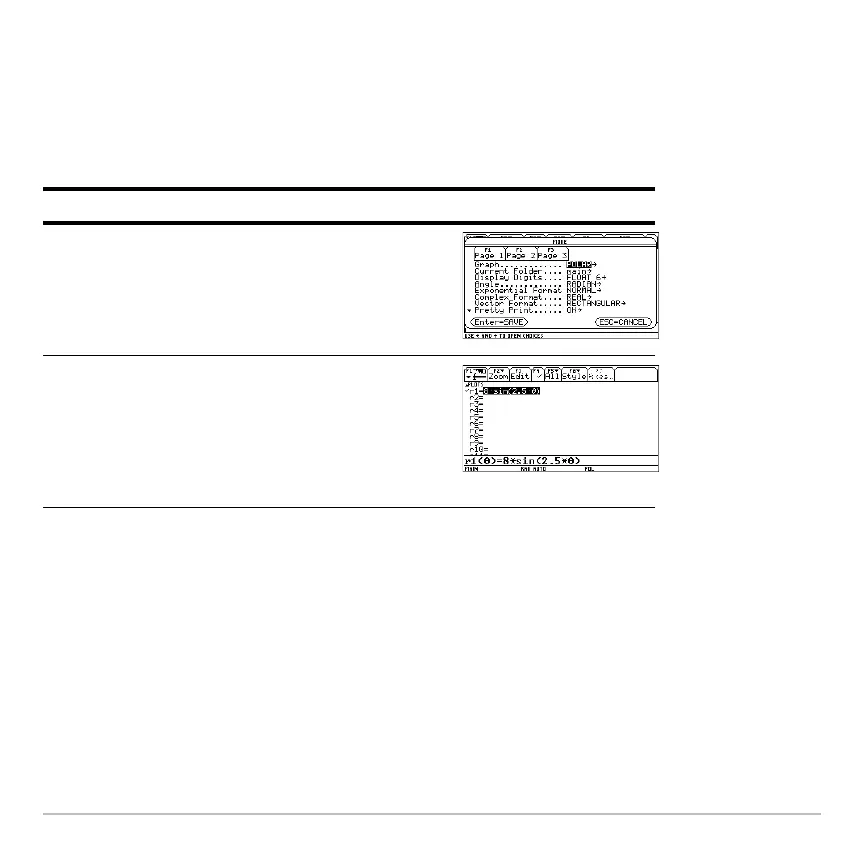
1. Display the MODE dialog box. For Graph
mode, select
POLAR. For Angle mode,
select
RADIAN.
Press 3 B 3 D D D B 1 ¸
2. Display and clear the
Y= Editor. Then
define the polar equation r1(q)=Asin Bq.
Enter 8 and 2.5 for A and B, respectively.
Press 8 # , 8 ¸ ¸ 8 W 2.5
Ï d ¸

Table of Contents

Other manuals for Texas Instruments Voyage 200

Questions and Answers:

Question and Answer IconNeed help?

Do you have a question about the Texas Instruments Voyage 200 and is the answer not in the manual?

Texas Instruments Voyage 200 Specifications

General IconGeneral
TypeScientific
Form factorPocket
Product colorBlue
Display resolution128 x 240 pixels

Related product manuals