Activities 753
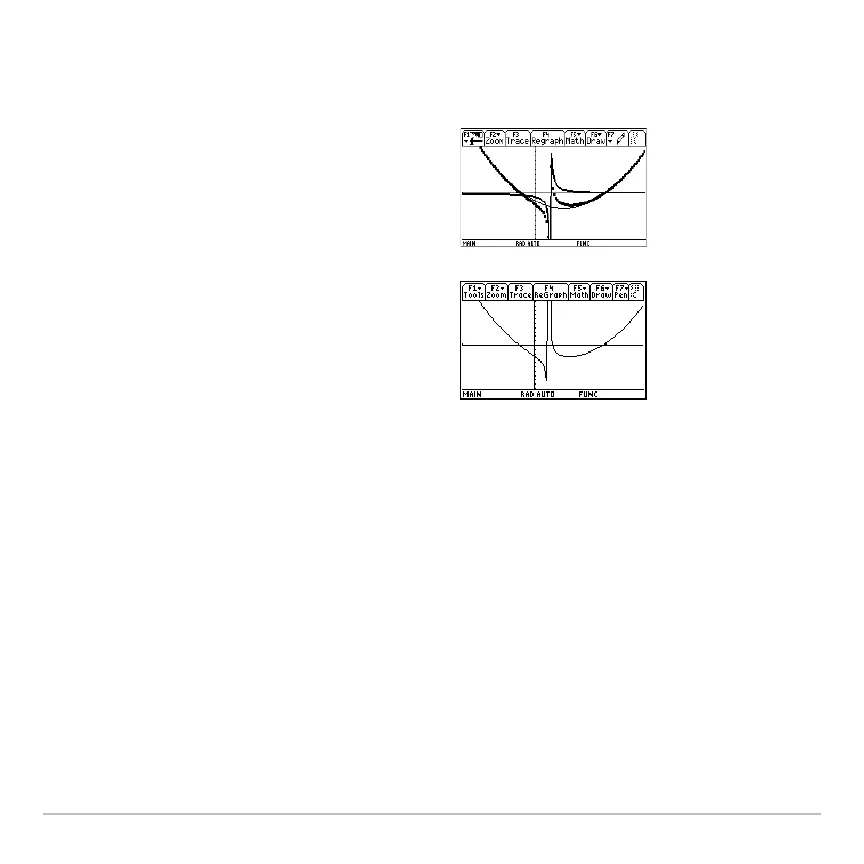
Observe that the global behavior of the f(x) function is basically represented by the
quadratic quotient
y2(x). The rational expression is basically a quadratic function as x
gets very large in both the positive and negative directions.
Studying Statistics: Filtering Data by Categories
Studying Statistics: Filtering Data by CategoriesStudying Statistics: Filtering Data by Categories
Studying Statistics: Filtering Data by Categories
This activity provides a statistical study of the weights of high school students using
categories to filter the data.
The lower graph is
y3(x)=f(x) graphed
separately using the line style.

 Loading...


