Numeric Solver 675
see how many solutions exist and use the cursor to select an accurate initial guess and
bounds.
Displaying the Graph
Displaying the GraphDisplaying the Graph
Displaying the Graph
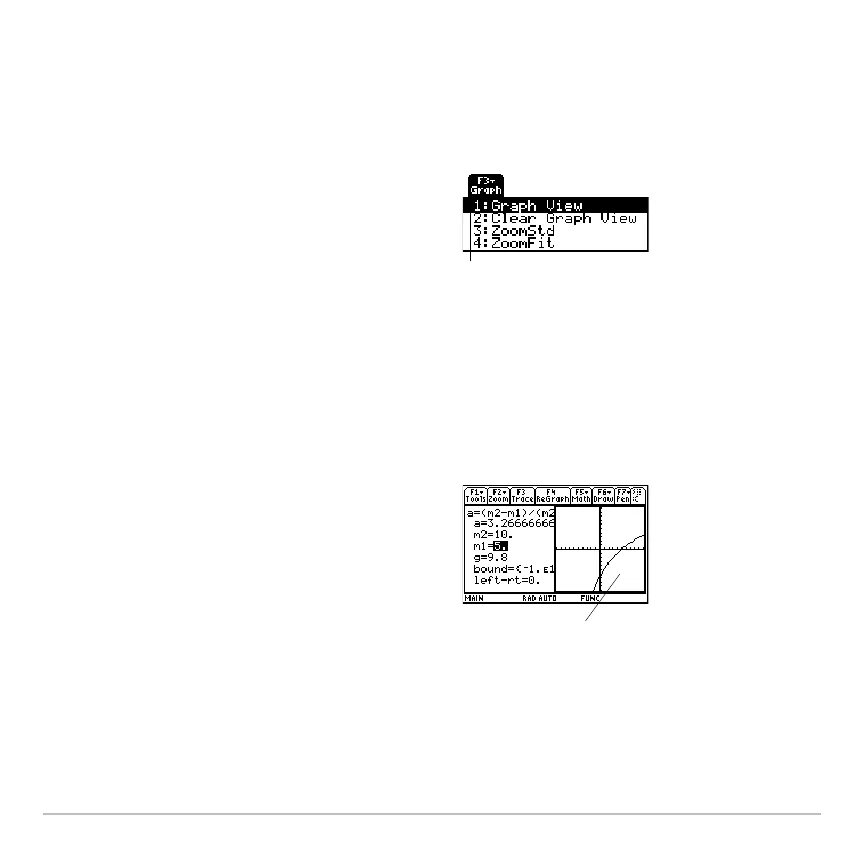
In the Numeric Solver, leave the cursor on the
unknown variable. Press … and select:
1:Graph View
– or –
3:ZoomStd
– or –
4:ZoomFit
The graph is shown in a split screen, where:
• The unknown variable is plotted on the x
axis.
•
leftNrt is plotted on the y axis.
Solutions for the equation exist at
leftNrt=0,
where the graph crosses the x axis.
Note: For more information, refer to the Split
Screens module.
Graph View uses the
current Window
variable values.
For information about
ZoomStd and
ZoomFit, refer to
Basic Function
Graphing.
The current graph
format settings are
used.

 Loading...


