Basic Function Graphing 300
Basic Function Graphing
Basic Function GraphingBasic Function Graphing
Basic Function Graphing
Overview of Steps in Graphing Functions
Overview of Steps in Graphing FunctionsOverview of Steps in Graphing Functions
Overview of Steps in Graphing Functions
To graph one or more y(x) functions, use the general steps shown below. For a detailed
description of each step, refer to the following pages. You may not need to do all the
steps each time you graph a function.
Graphing Functions
Graphing FunctionsGraphing Functions
Graphing Functions
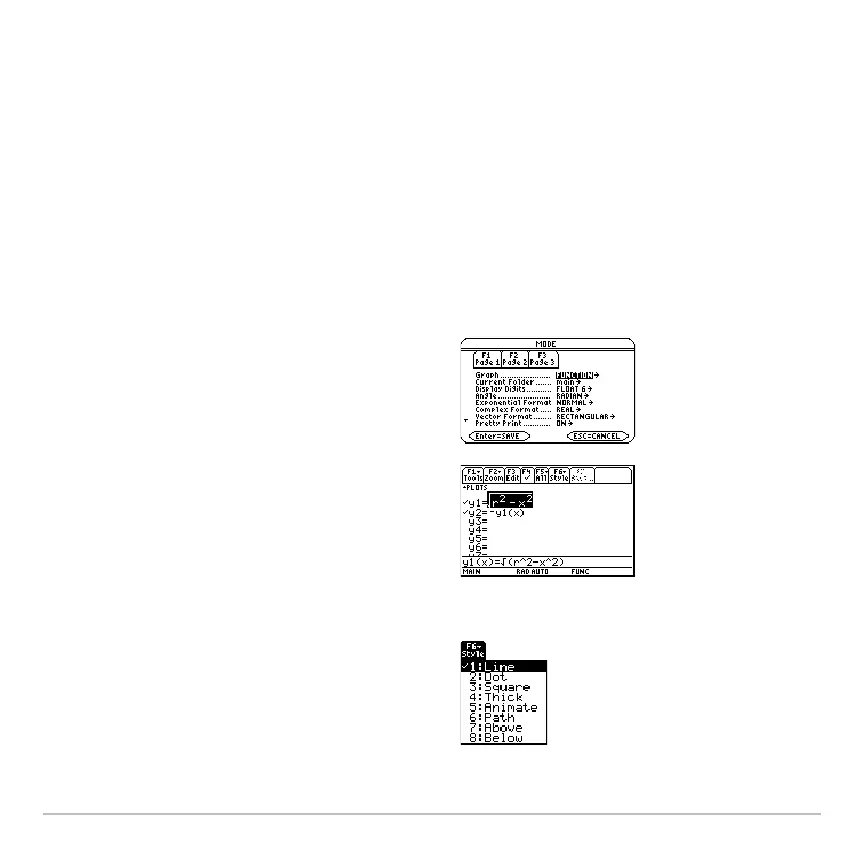
1. Set
Graph mode (3) to FUNCTION.
Also set
Angle mode, if necessary.
2. Define x and y components on Y= Editor
(8#).
3. Select (†) which defined functions to
graph.
Note: To turn off any stat data plots, press
‡
5 or use † to deselect them.
4. Set the display style for a function.
ˆ
This is optional. For multiple equations,
this helps visually distinguish one from
another.

 Loading...


