Basic Function Graphing 301
Exploring the Graph
Exploring the GraphExploring the Graph
Exploring the Graph
From the Graph screen, you can:
• Display the coordinates of any pixel by using the free-moving cursor, or of a plotted
point by tracing a function.
•Use the „
Zoom toolbar menu to zoom in or out on a portion of the graph.
•Use the ‡
Math toolbar menu to find a zero, minimum, maximum, etc.
Setting the Graph Mode
Setting the Graph ModeSetting the Graph Mode
Setting the Graph Mode
Before graphing y(x) functions, you must select FUNCTION graphing. You may also
need to set the Angle mode, which affects how the Voyage™ 200 Graphing Calculator
graphs trigonometric functions.
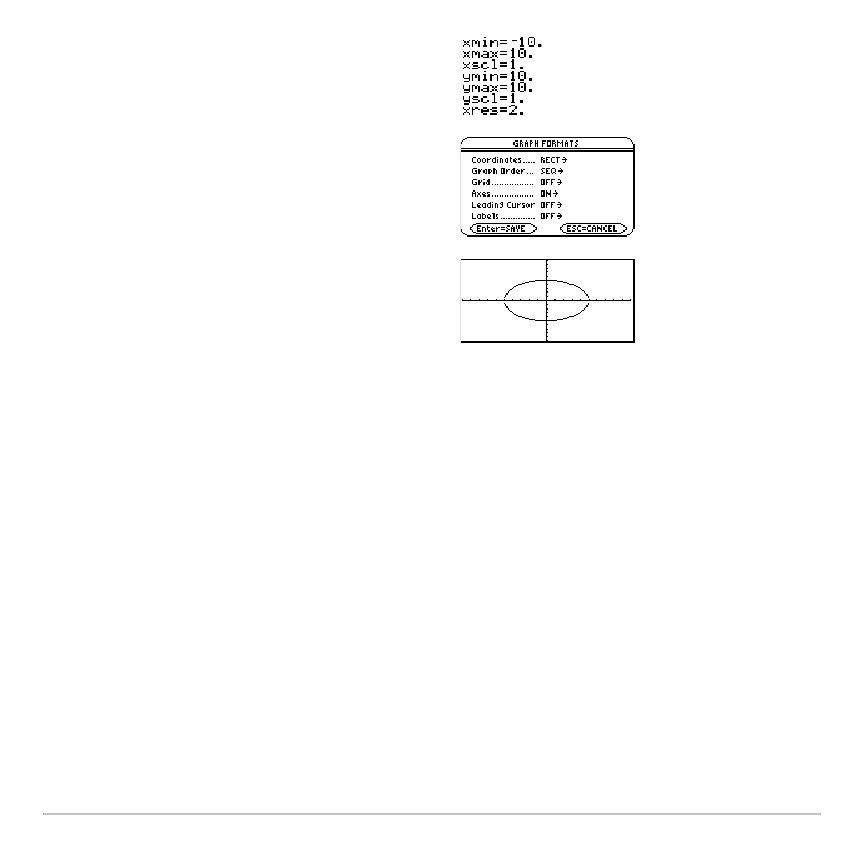
5. Define the viewing window (8 $).
„
Zoom also changes the viewing
window.
6. Change the graph format if necessary.
ƒ
9
– or –
8
F
7. Graph the selected functions (8%).

 Loading...


