General Operation
100 TVM Series Installation and Operation Handbook
Copyright © 2008, Harris Corporation
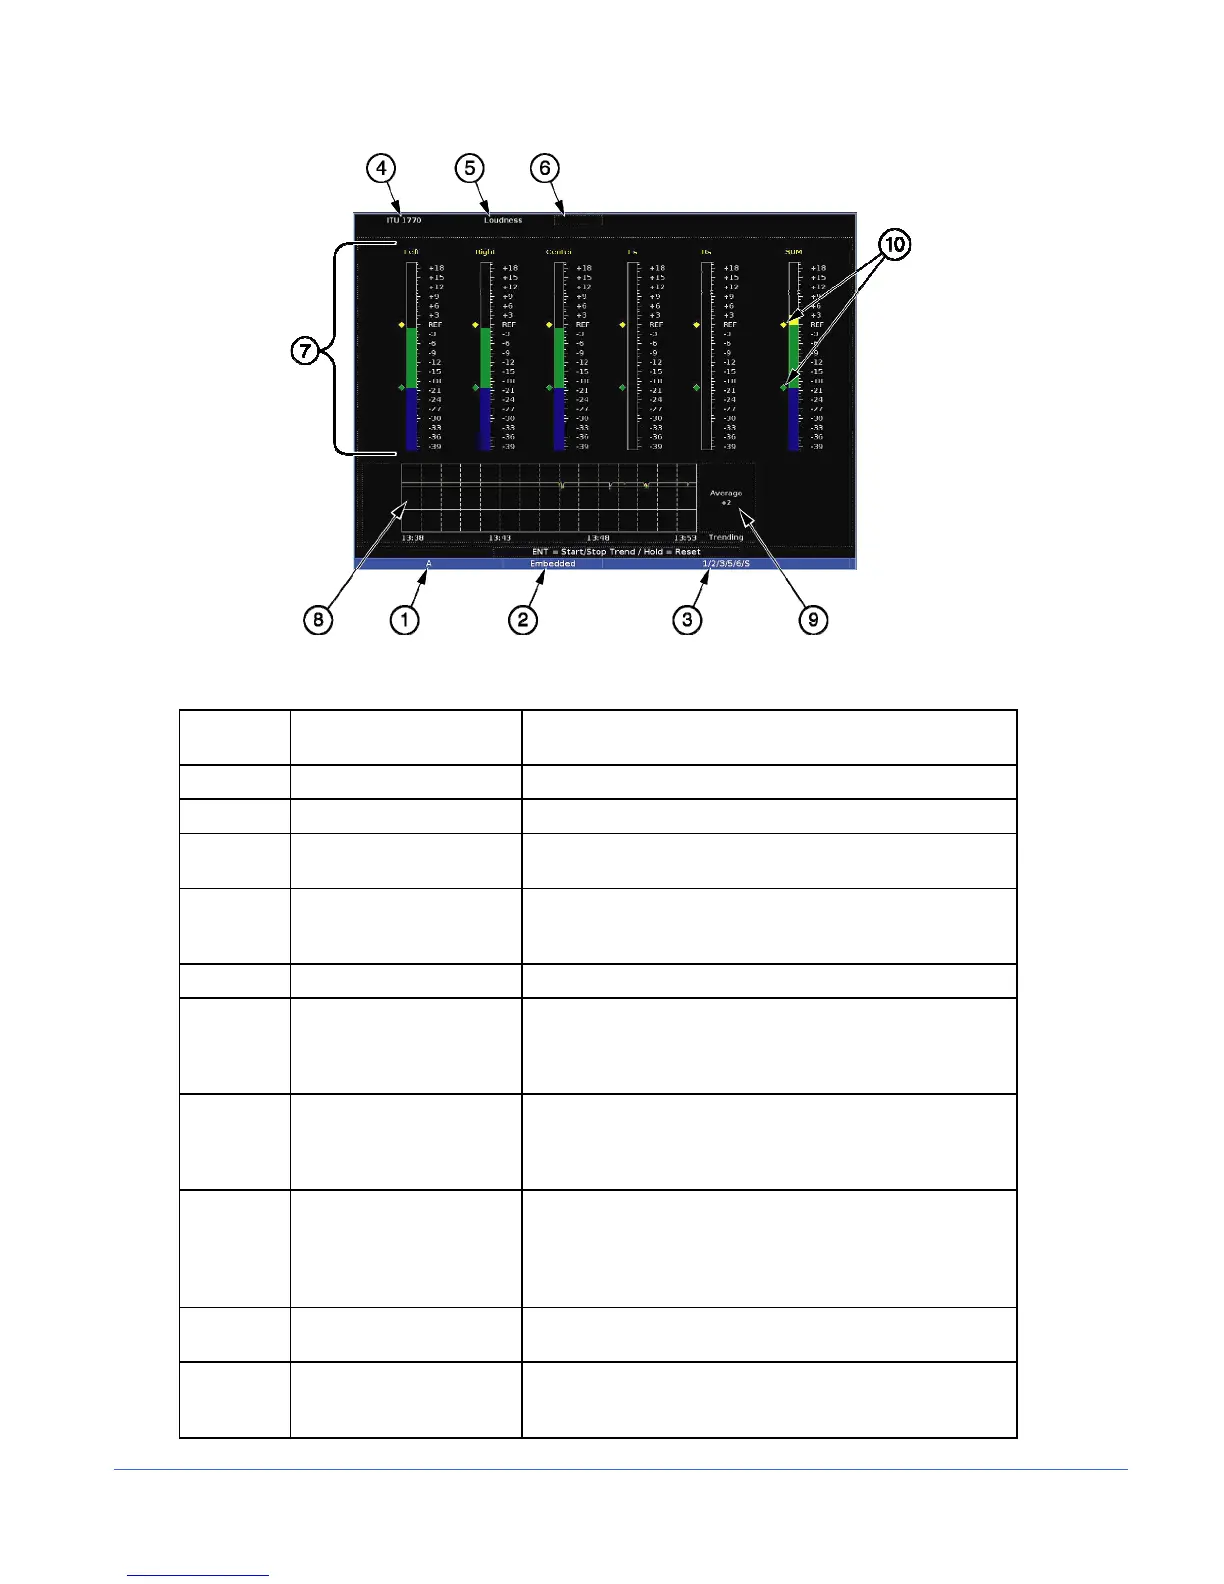
Figure 3-57. Loudness Display Diagram (TVM-A3-OPT 3-TL or TVM-A3-OPT 5-TL
Table 3-46. Description of Loudness Display Diagram
Field
Identifier
Field Information Nomenclature
1 Input Displays user-configurable source IDs for input and routers
2 Audio Type Displayed as Analog, AES, or Embedded
3 Monitored Audio Input
Channel
Displayed information is option dependent; shown as 1 to
16 (Analog is 1-8, AES is 1-16 or 1-8, Embedded is 1-16)
4 Algorithm used Algorithm based on the ITU-R BS.1770 standard for the
RLB filter; Algorithm based on the IEC 61672-2 standard
for the A weighting filter
5 Loudness Displays the Meter Type
6 Zoom
• Zoom displayed (when enabled)
• Blank when disabled
• Press the ZOOM button to toggle the zoom mode off
and on.
7 Audio Meters (with meter
labels)
Shown as Left, Right, Center, Ls, Rs, and SUM (or the
average loudness for all audio channels); these are the
default labels (labels are grayed out for non-selected
channels)
8 Trend Chart The Trend Chart is used to view short-term loudness
readings for the user-selectable time period. The time can
range from 0.25 hours to 24 hours. Press the ENT button
to Start and Stop the Trending chart. Press and hold the
ENT button for five seconds to clear the trending chart.
9 Average Indication Numeric average loudness dB level readout of all selected
channels over the chart duration
10 Level Meters Shows the reference and preferred range levels for the
signal; this can be set in the AUDIO SETUP > METER
SETUP > REFDIGITAL (or ANALOG) menu