General Operation
54 TVM Series Installation and Operation Handbook
Copyright © 2008, Harris Corporation
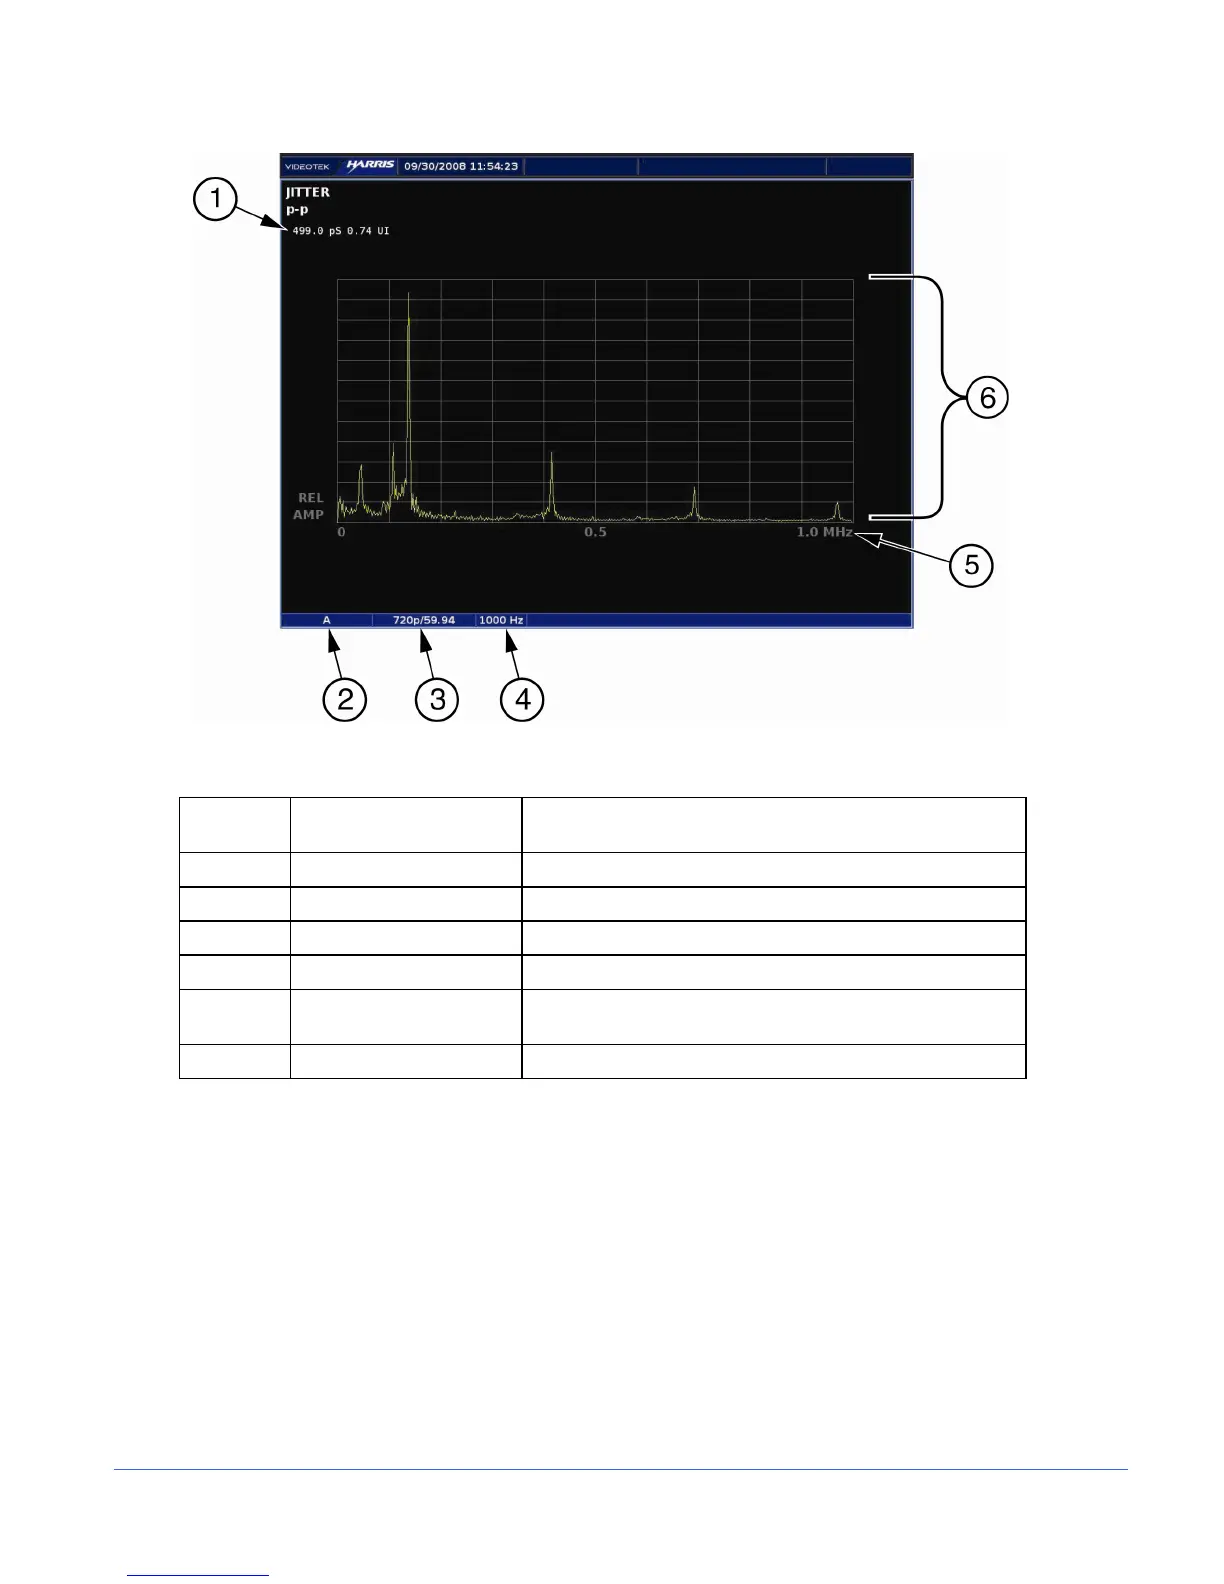
Figure 3-23. Frequency Waveform Display Diagram
Table 3-18. Description of Frequency Waveform Display Diagram
Field
Identifier
Field Information Nomenclature
1 Jitter p-p Value Display a numeric value for the jitter on the signal
2 Input Displays user-configurable source IDs for input and routers
3 Standard Line rate/Frame rate
4 High Pass Filter Displays selected jitter filter
5 Horizontal Frequency
Scale
Displays Jitter graticule shown relative to frequency
6 Jitter graticule Displays Frequency Sweep graticule shown in p-p