Working with Application Graphs Applications
Agilent 8163A Lightwave Multimeter, Agilent 8164A Lightwave Measurement System, & Agilent 8166A Lightwave
Multichannel System, Fourth Edition
159
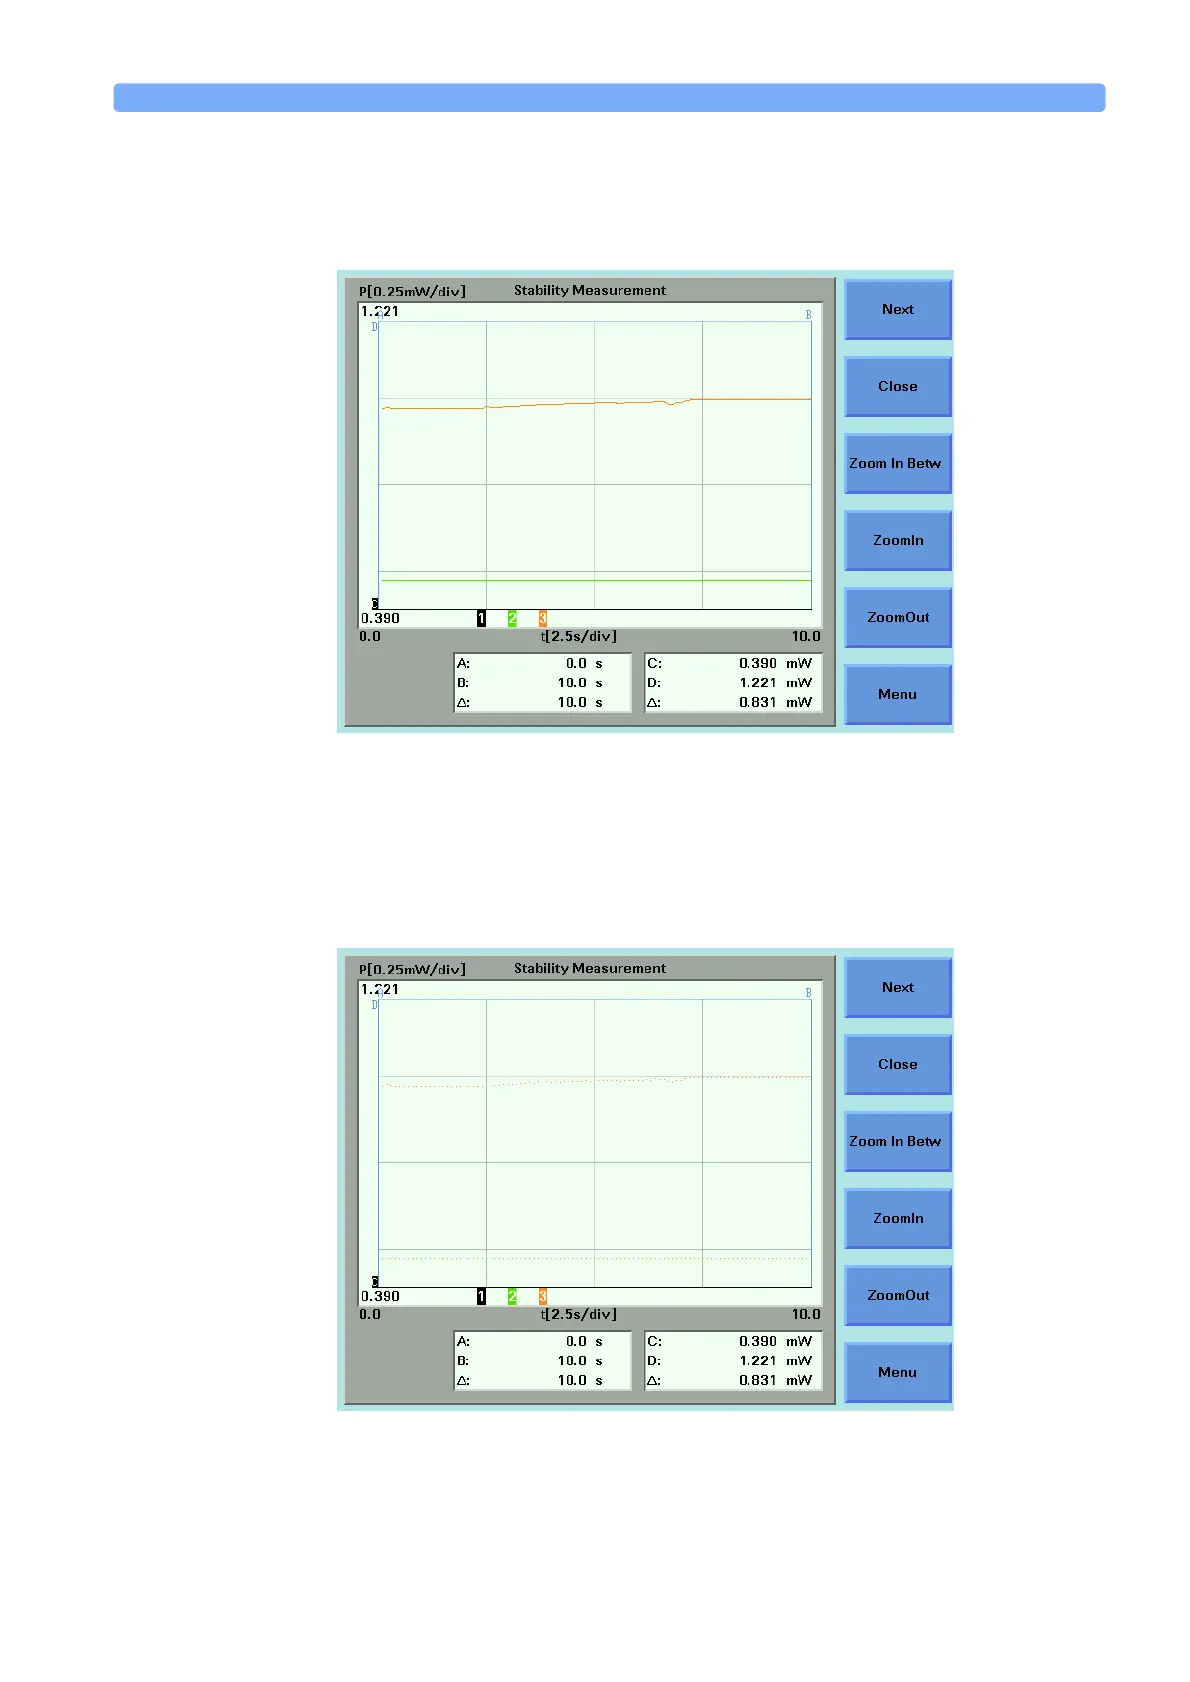
– <Line> - the curve will be displayed using a line that connects between each
sample of the curve.
– <Samples> - the curve will be displayed using dots to represent each sample
of the curve. Depending on the zoom level you choose, if these dots are very
close to each other, the curve will resemble a line.
Figure 110 Samples Display - <Line>
Figure 111 Samples Display - <Samples>
 Loading...


