Applications Working with Application Graphs
160 Agilent 8163A Lightwave Multimeter, Agilent 8164A Lightwave Measurement
System, & Agilent 8166A Lightwave Multichannel System, Fourth Edition
– <Samples & Line> - the curve will be displayed using both symbols for each
sample of the curve and a line connecting each sample.
2 Move to your selected option and press Enter.
3 Press the [Close] softkey to return to the graph.
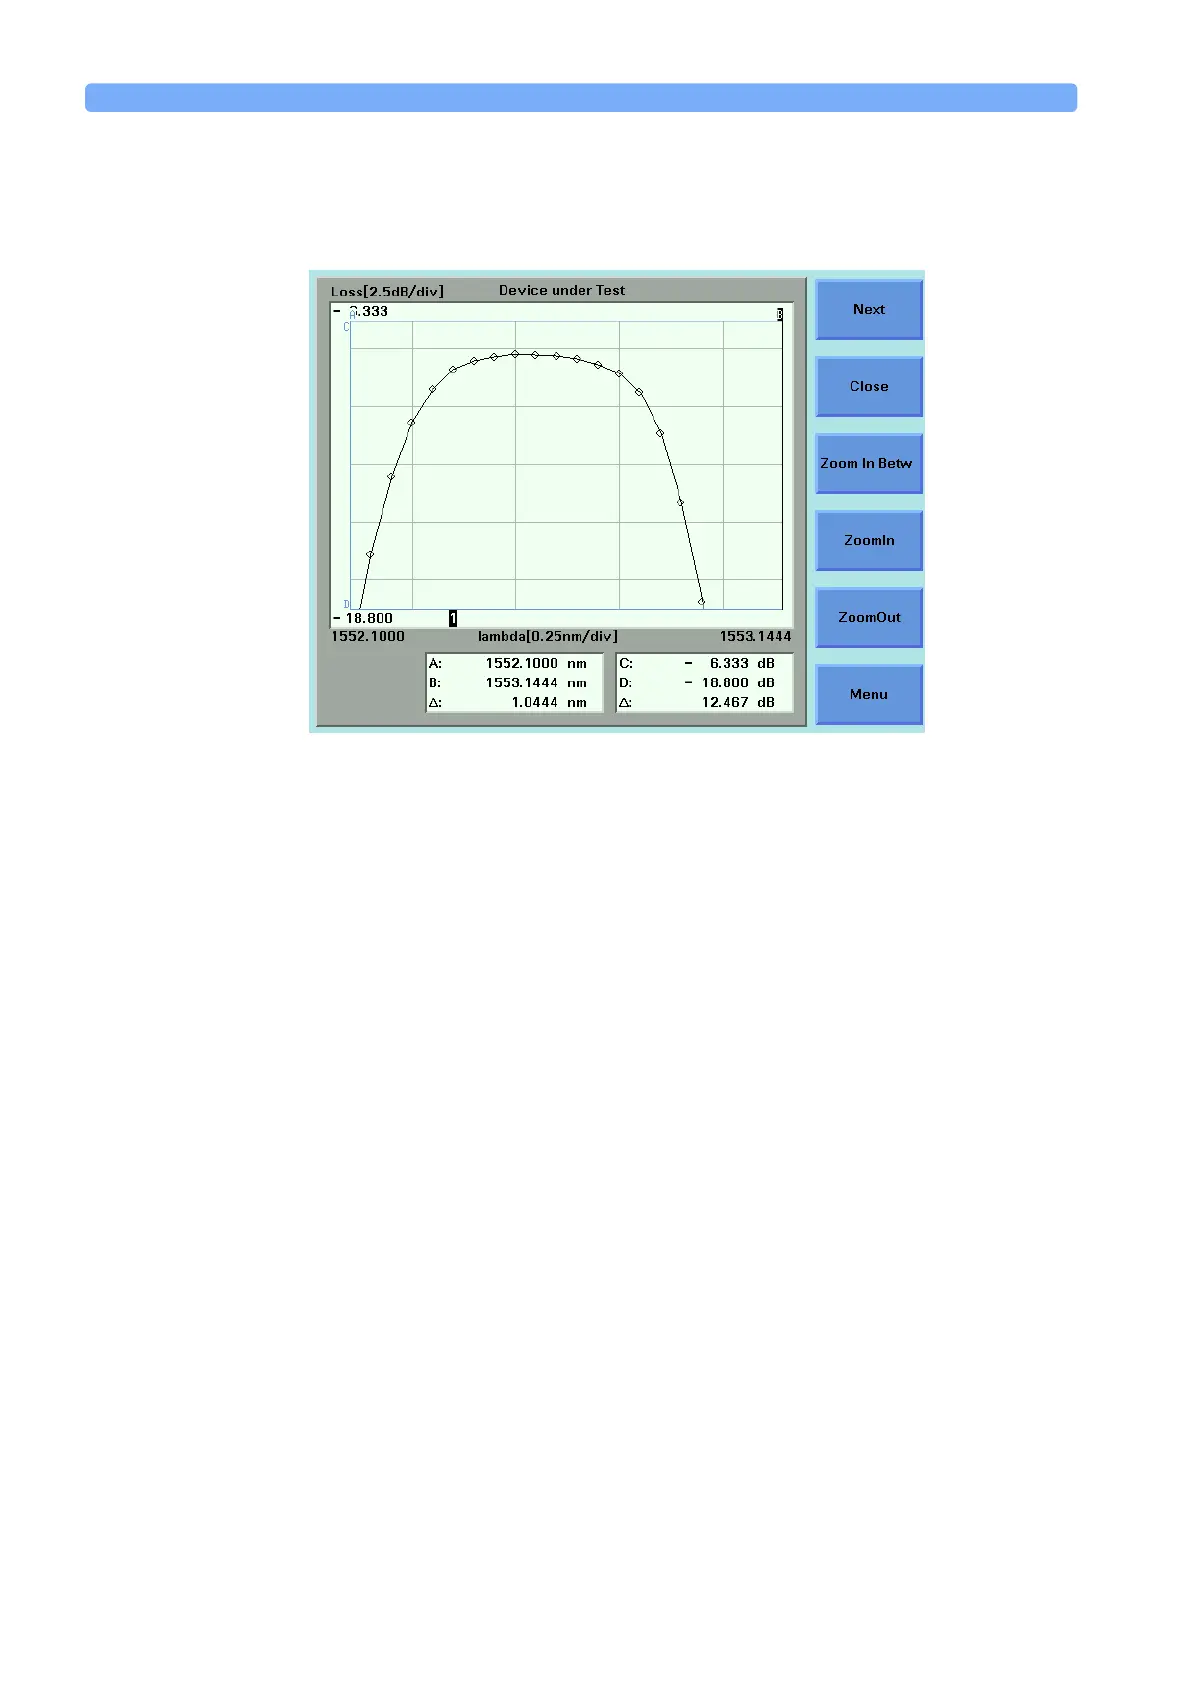
How to Read Curve Values
You can lock markers A or B to a curve in order to move between individual
samples. In this way, you can read the time/wavelength and power values that
relate to each sample and the difference between these values for markers A and
B.
Figure 112 Samples Display - <Samples & Line>
 Loading...


