6. Redundancy with NX3030 CPU
344
Redundancy Diagnostics (RedDgnLoc and RedDgnRem), already described in the Redundancy
Diagnostics Structure section
Redundancy Commands (RedCmdLoc and RedCmdRem), already described in the Redundancy
Commands section
User Information Exchanged between PLCA and PLCB (RedUsrLoc and RedUsrRem), which
are described in this section
The RedUsrLoc and RedUsrRem structures are simply a 128 bytes array, which utilization can be
freely defined by the user. They allow the user to transfer, each cycle, 128 bytes of information from
PLCA to PLCB, and other 128 bytes from PLCB to PLCA.
RedUsrRem is a copy from the other PLC RedUsrLoc, received through NETA / NETB. A specific
PLC writes information on RedUsrLoc, which are read in the RedUsrRem of the other PLC.
These data structures have many utilities. E.g. supposing the SCADA system is connected only to the
Active PLC and it’s desired to visualize some information from the Non-Active PLC. The Non-
Active PLC can put this information in these data structures. Among such information, for instance,
might be some not mapped diagnostics in RedDgnLoc and RedDgnRem.
Modbus Diagnostics used at Redundancy
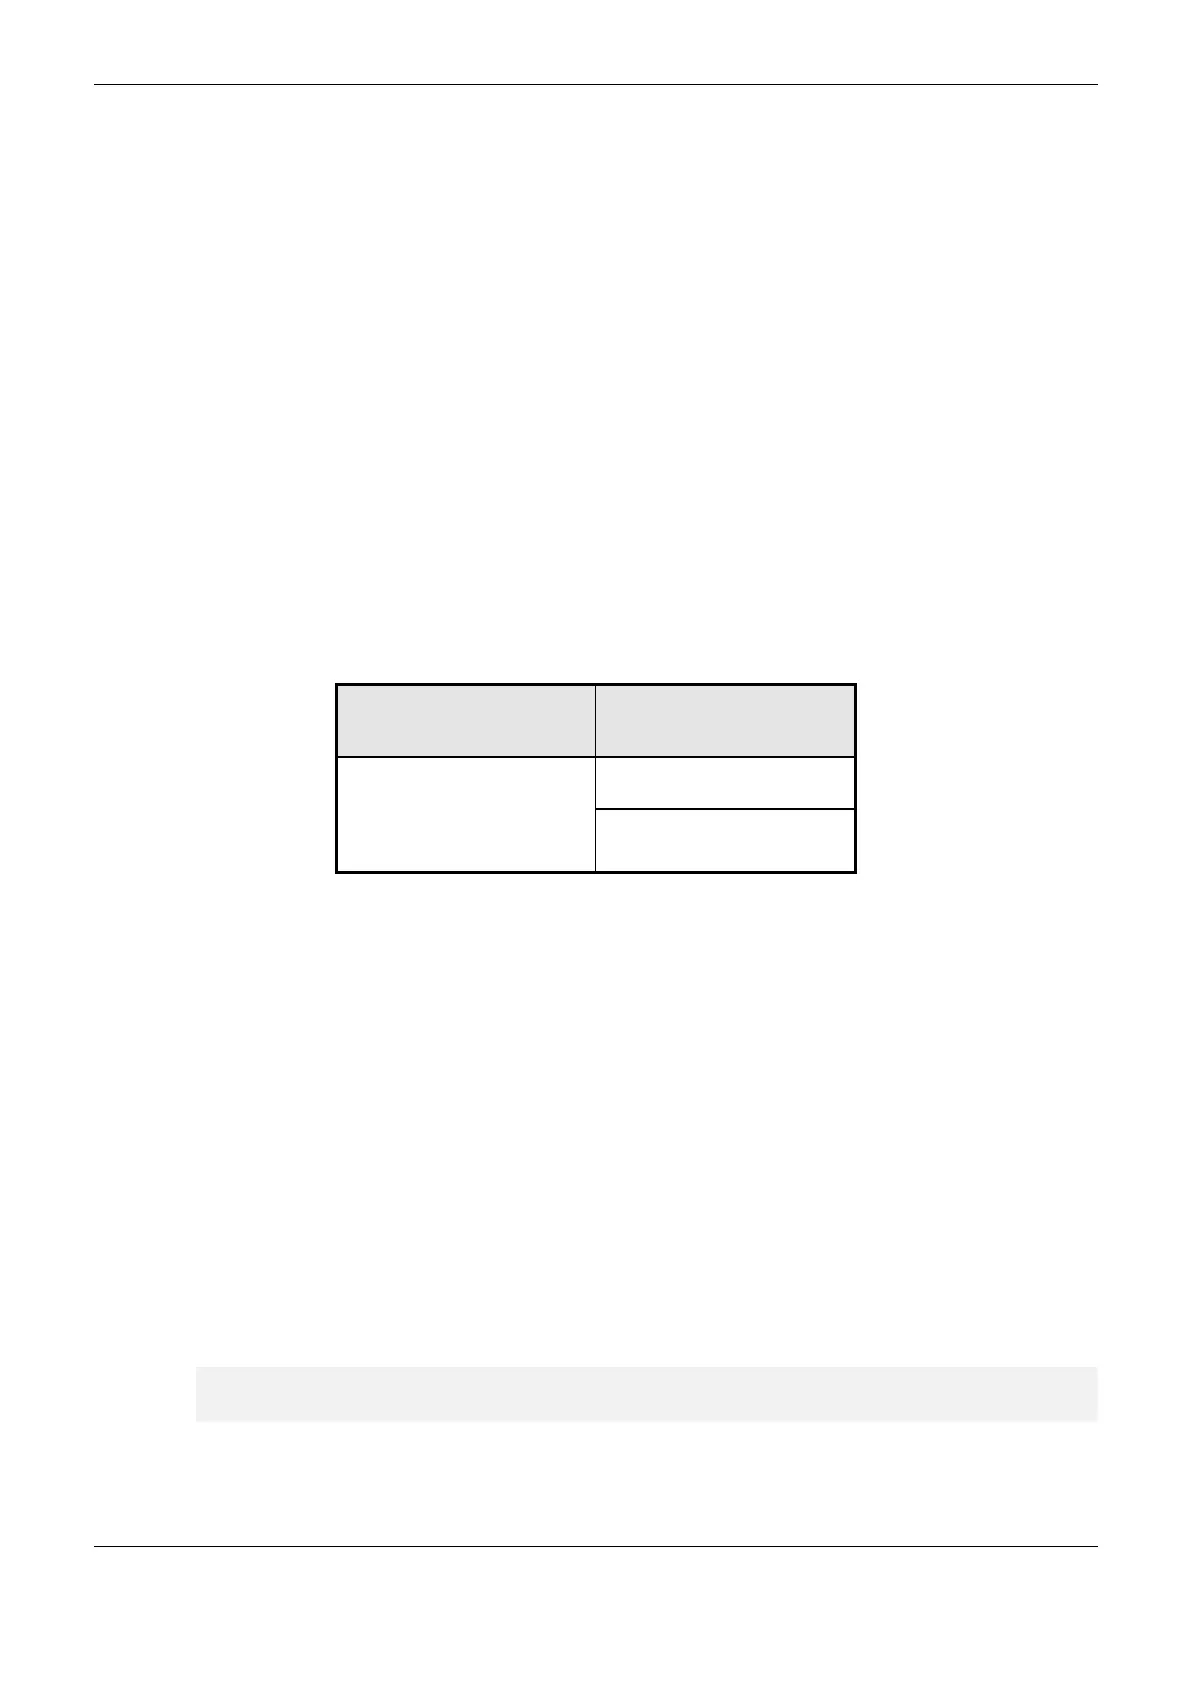
To check for failure in all MODBUS Server configured in a MODBUS Client instance, there is a
specific diagnosis in each MODBUS Client instance configured. Table 6-12 displays the diagnostics
for this type of failure in a MODBUS Client instance called MODBUS_Symbol_Client.
Variable
DG_MODBUS_Symbol_Client.t
Diag.*
TRUE – All servers configured at
this Client shows error
FALSE – There is at least um
Server configured in this Client
that doesn’t shows error
Table 6-12. Modbus Client Diagnostic
When configured vital failure mode, this diagnostic is consulted and 3 seconds after it’s state change
from FALSE to TRUE, a switchover occurs if the other conditions for this event are satisfied.
Redundancy Event Log
MasterTool allows the observation of several logs for the Nexto PLC, among them the Redundancy
Event Log. These messages, specific for redundancy, register in the System Log relevant
modifications in the diagnostics data structure fields and redundancy commands structure data.
Each line presented in the log has the following columns:
Timestamp: event time and date, with resolution in milliseconds
Severity: information, warning, error or exception
Description: text that describes the event
Component: component that has generated the event, and in the Redundancy Event Log case, is
“Redundancy Management”
The “Description” column text has information about the event that happened:
An example of the Description column can be the following:Redundancy new state (local):
Starting
To access this screen, a double click must be done on the device (NX3030) in the device tree, and
then the tab “Log” must be selected. There’s a filter that allows selecting only the “Redundancy
Management” component, to show only the redundancy events.
 Loading...